Methodology and Data Interpretation
Section 1: Disinformation about prominent scientists
The Avaaz investigative team analysed misinformation content targeting Anthony Fauci in the US, Christian Drosten in Germany and Marc Van Ranst in Belgium, fact-checked between January 1, and June 30, 2021, and meeting the following criteria:
-
Were fact-checked by Facebook’s third-party fact-checking partners or other reputable fact-checking organisations.
50
-
Were rated “false” or “misleading'' or any of the following ratings according to the tags used by the fact-checking organisations in their fact-check article:
-
Inaccurate, Misleading, Misrepresented, Misrepresenting, Missing context, No evidence, Not true, Partially false, Partly false, Wrong, False
-
Could cause harm by undermining public health. Avaaz has included content that impacts public health in the areas of:
-
Creating distrust in health institutions, health organisations, medical practice and their recommendations:
e.g., false information implying that clinicians or governments are creating or hiding health risks.
-
Fearmongering:
health-related misinformation that can induce fear and panic, e.g., misinformation stating that the coronavirus is a human-made bio-weapon being used against certain communities or that Chinese products may contain the virus.
-
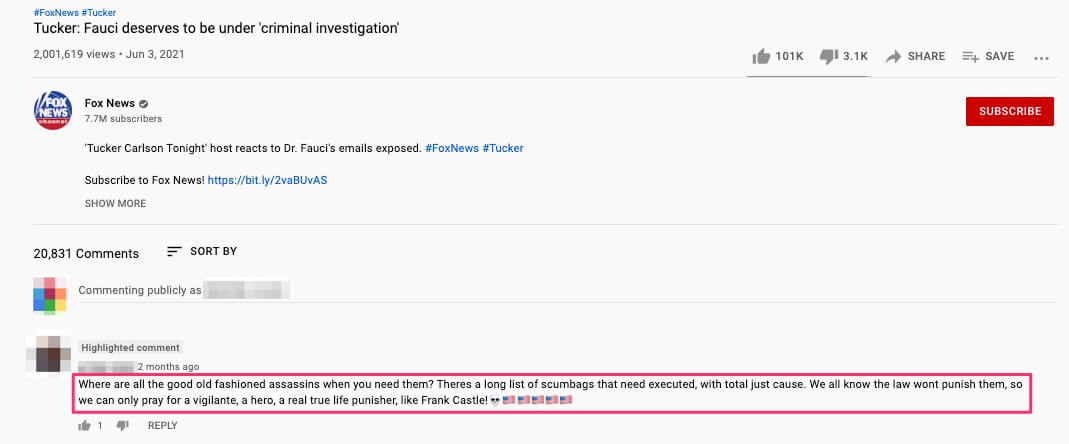
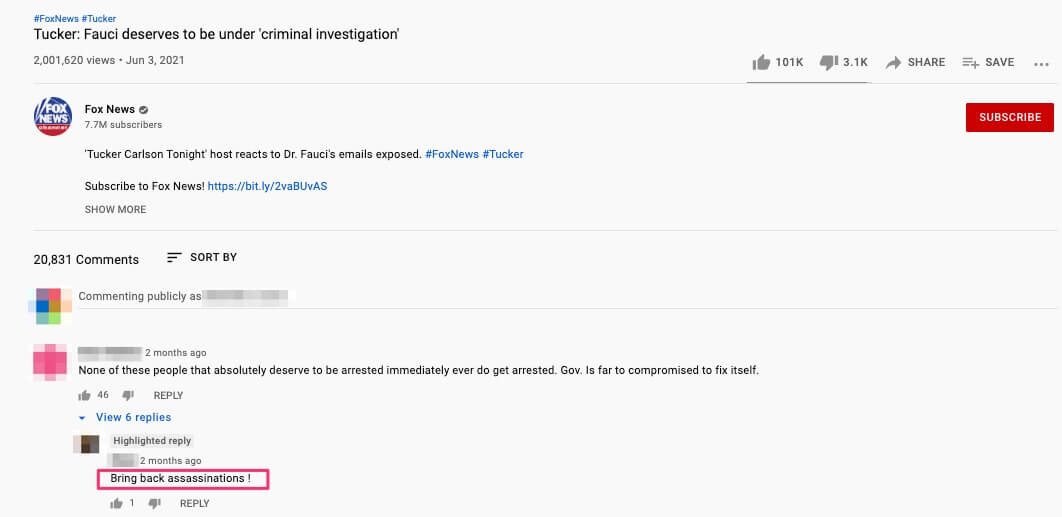
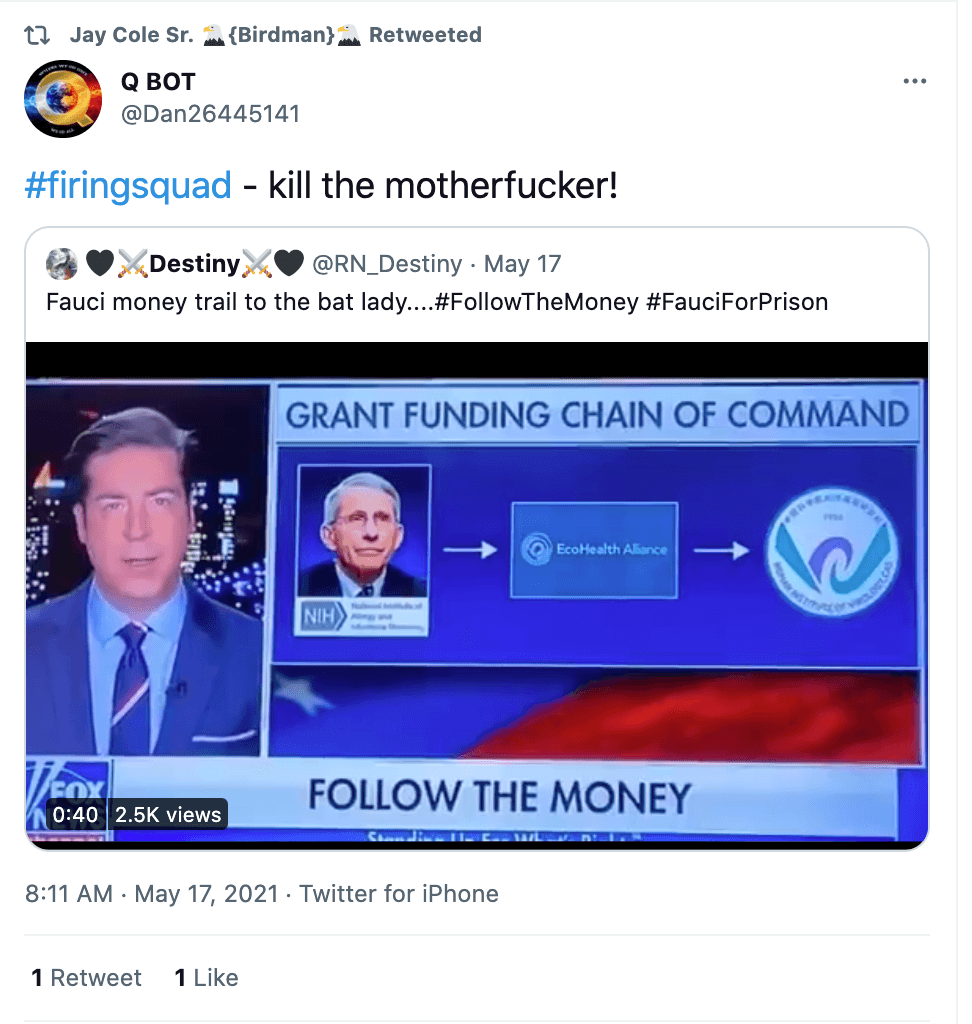
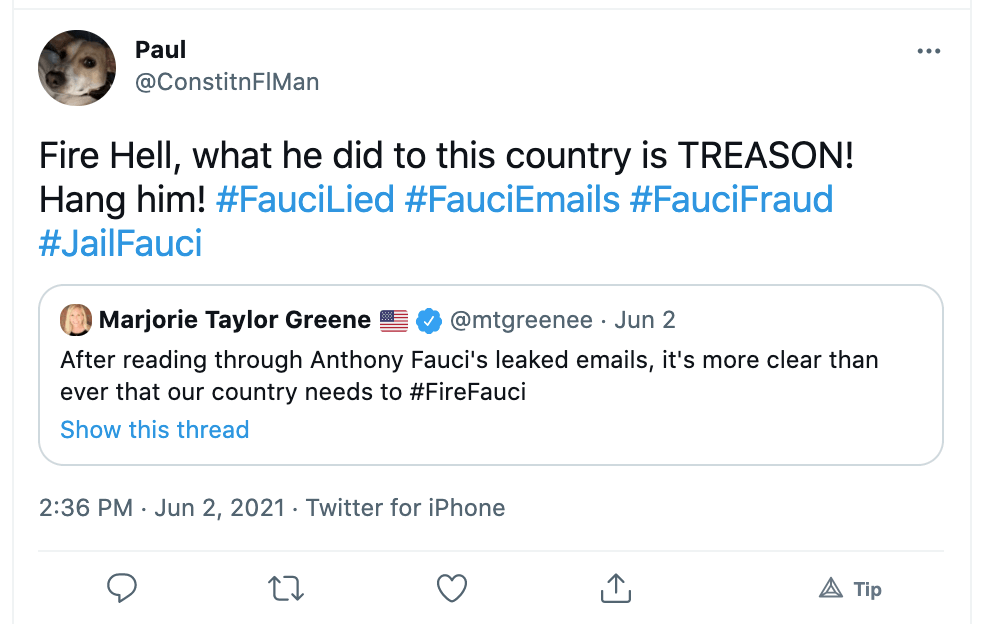
Included dehumanising language, death threats, insults or degrading language towards any one of the scientists selected for this research and present within the social media publication itself or in the comments below it.
Methodology for measuring Facebook labelling and removals
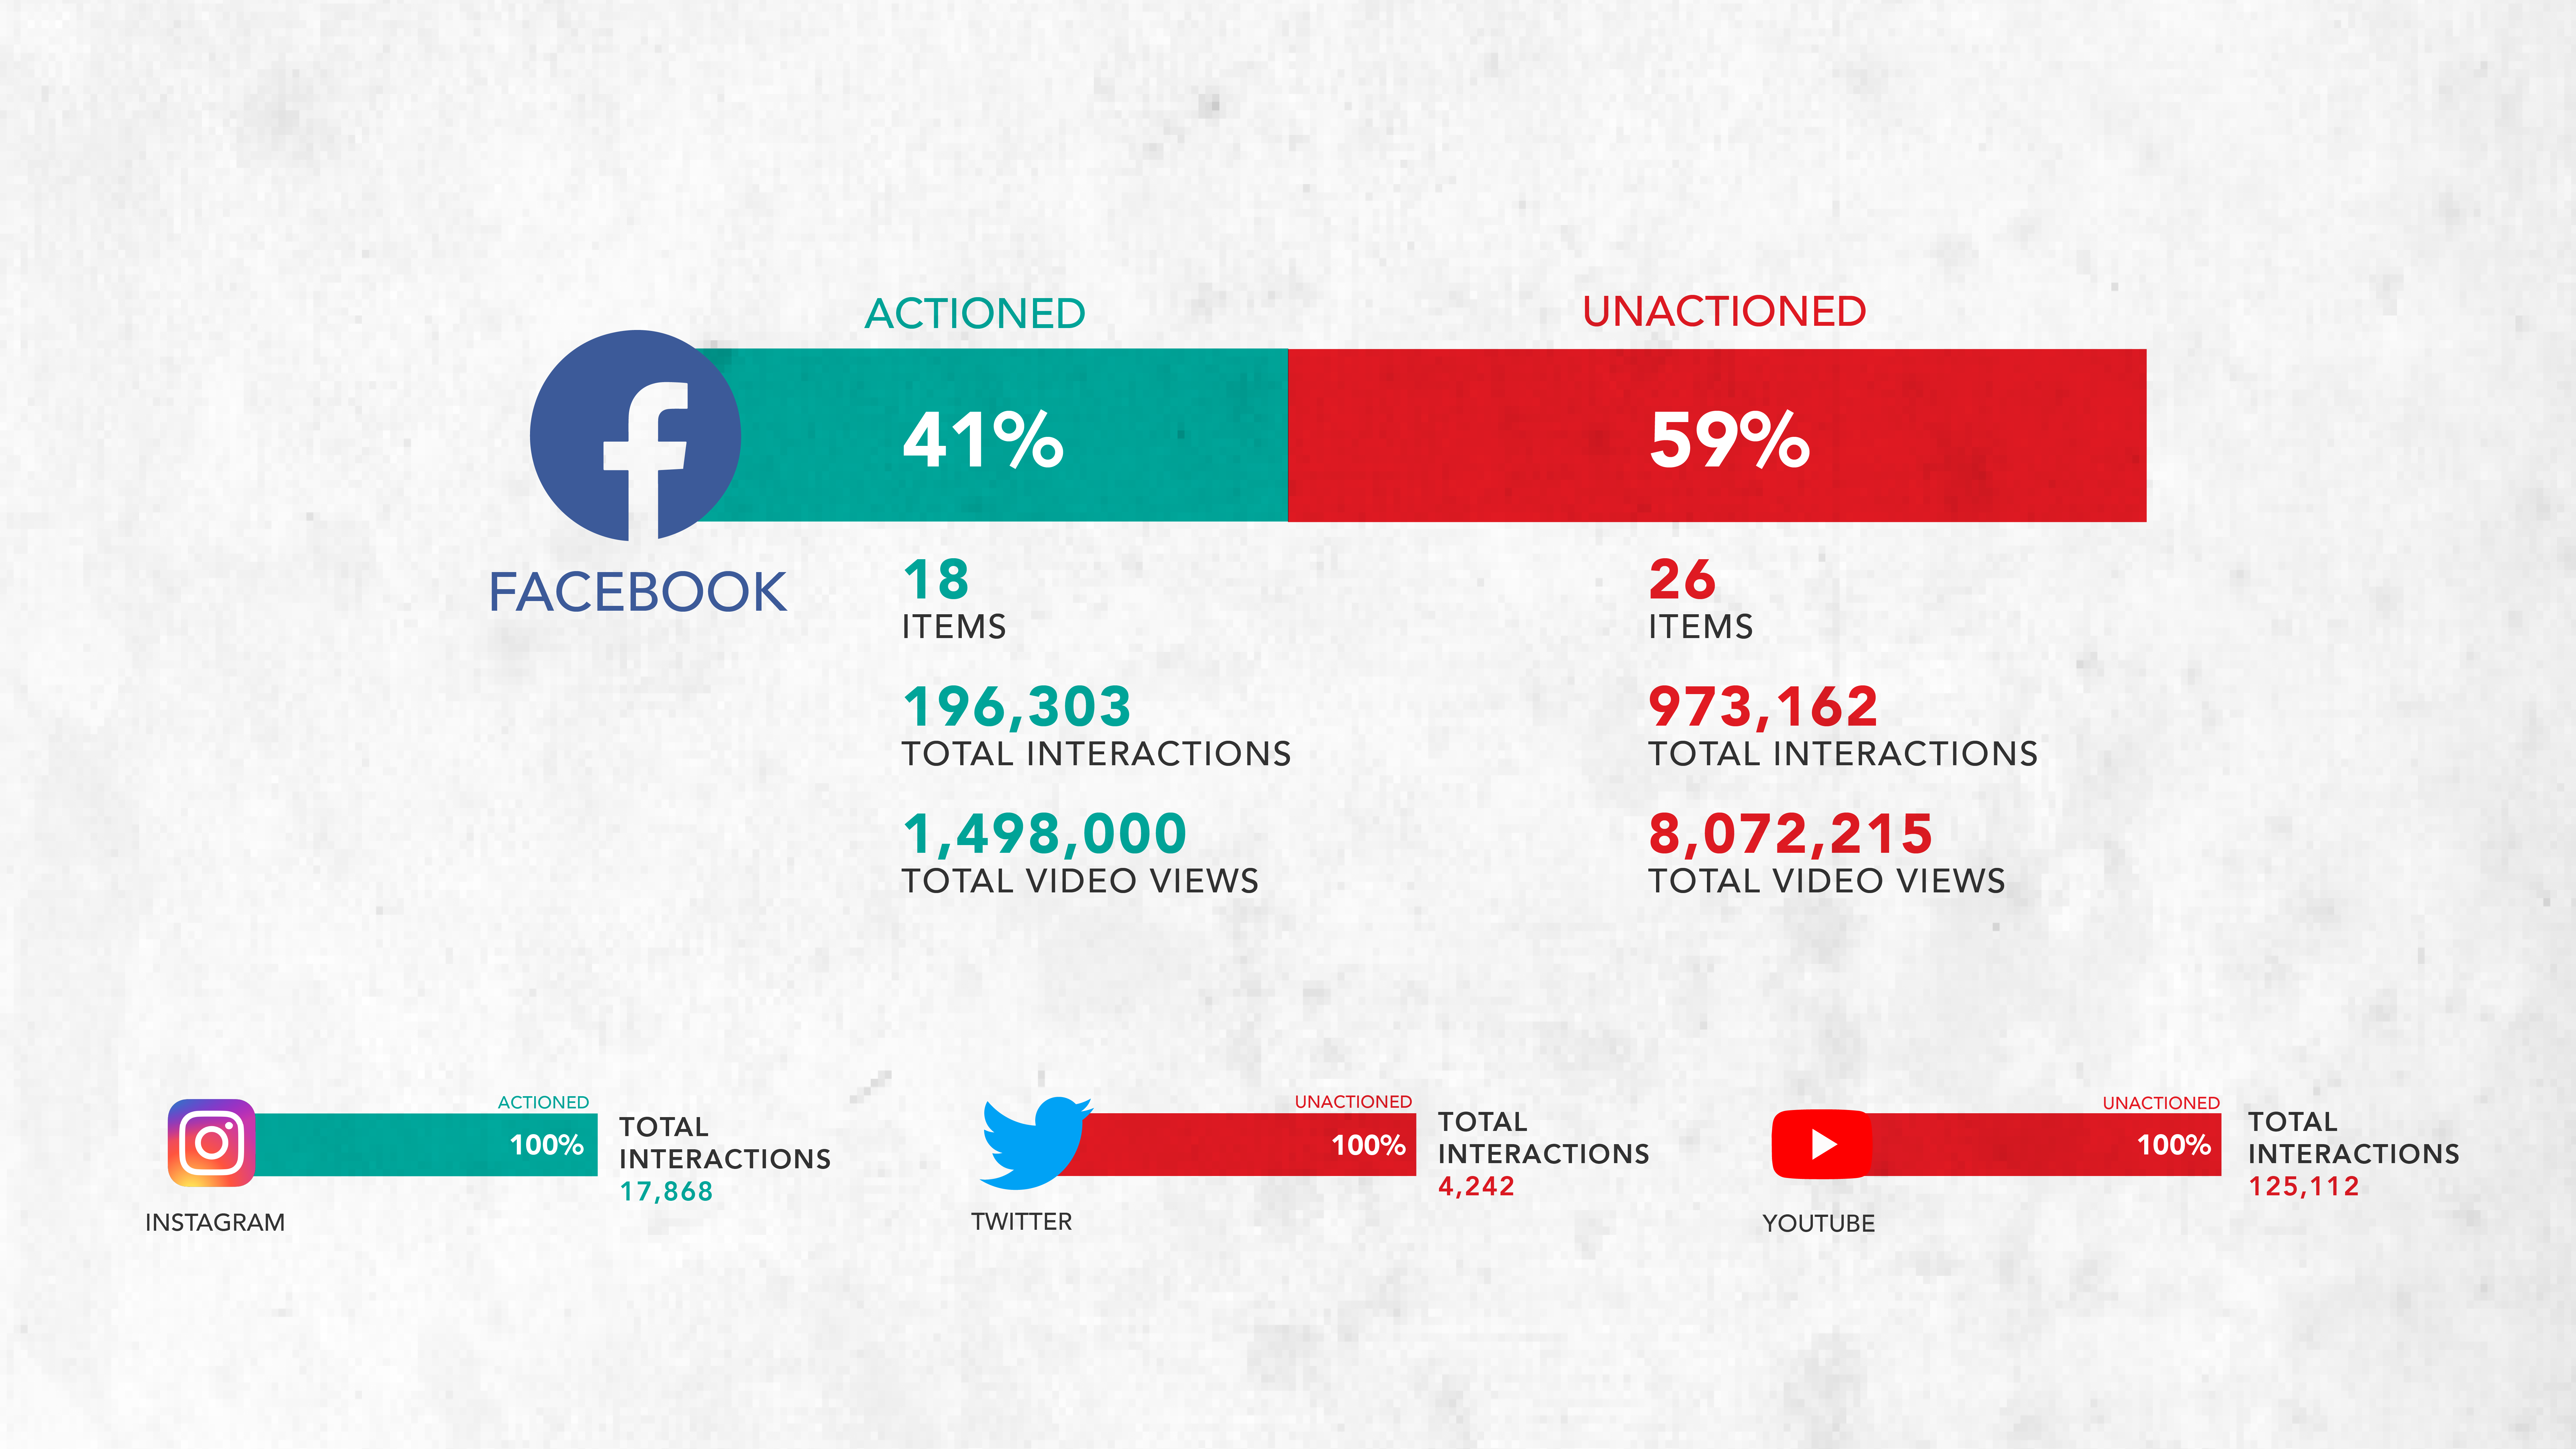
For the purpose of measuring Facebook’s stated claims about its fact-checking efforts and its commitment to fight against the spread of misinformation, the investigative team analysed a sample of 85 posts
51
based on the above criteria.
For each of the false and misleading posts and stories sampled, Avaaz researchers recorded and analysed, using both direct observation and
CrowdTangle:
52
-
The total number of interactions it received;
-
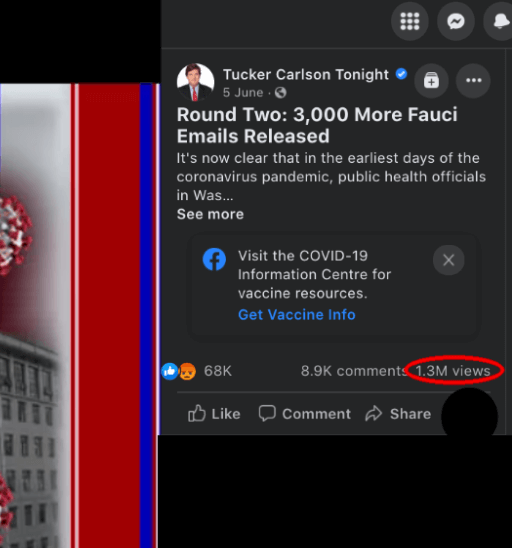
The total number of views it received in the case of Facebook videos;
-
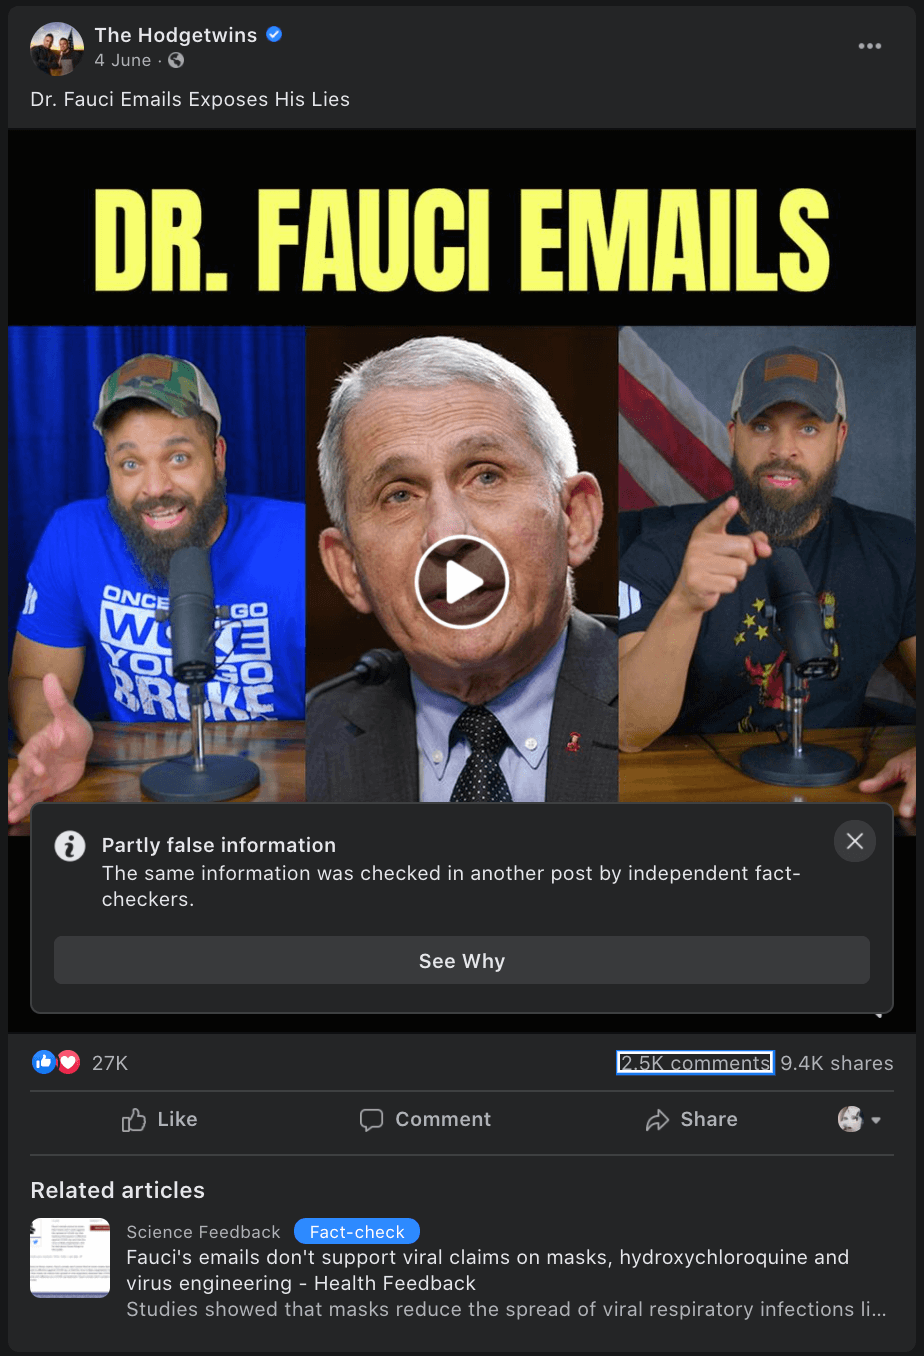
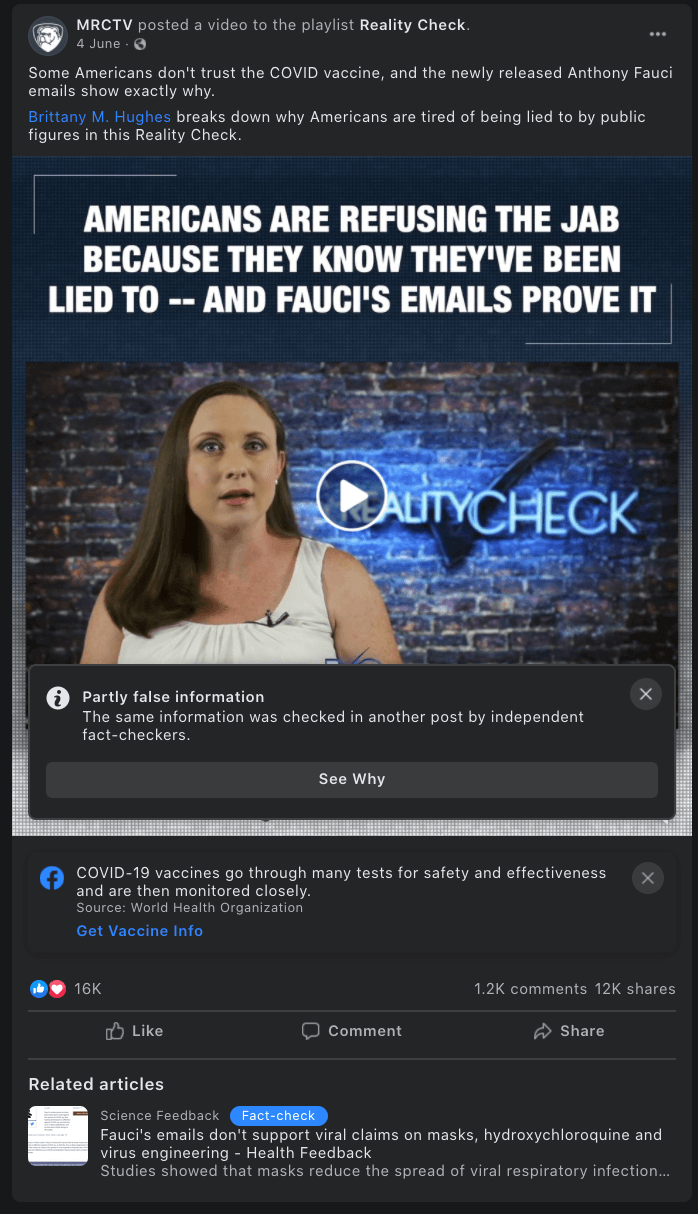
Whether each had a warning label as false or misleading
53
added by Facebook;
54
-
When misinformation posts would receive a fact-check warning label or be removed.
55
Methodology for identifying ‘clones’ and ‘variants’
During the research process, our investigative team noticed that posts previously documented using the methodology above and collected on other large social media platforms
56
were spreading in an exact, or slightly altered, fashion on Facebook. Our team further investigated eight narratives from our sample of 85 posts, to conduct a dedicated research of the spread of such “clones” and “variants”.
We used
CrowdTangle
57
to search text from the original post we had documented to identify public shares of the same content - or variations of it - shared by Facebook pages, public groups or verified profiles.
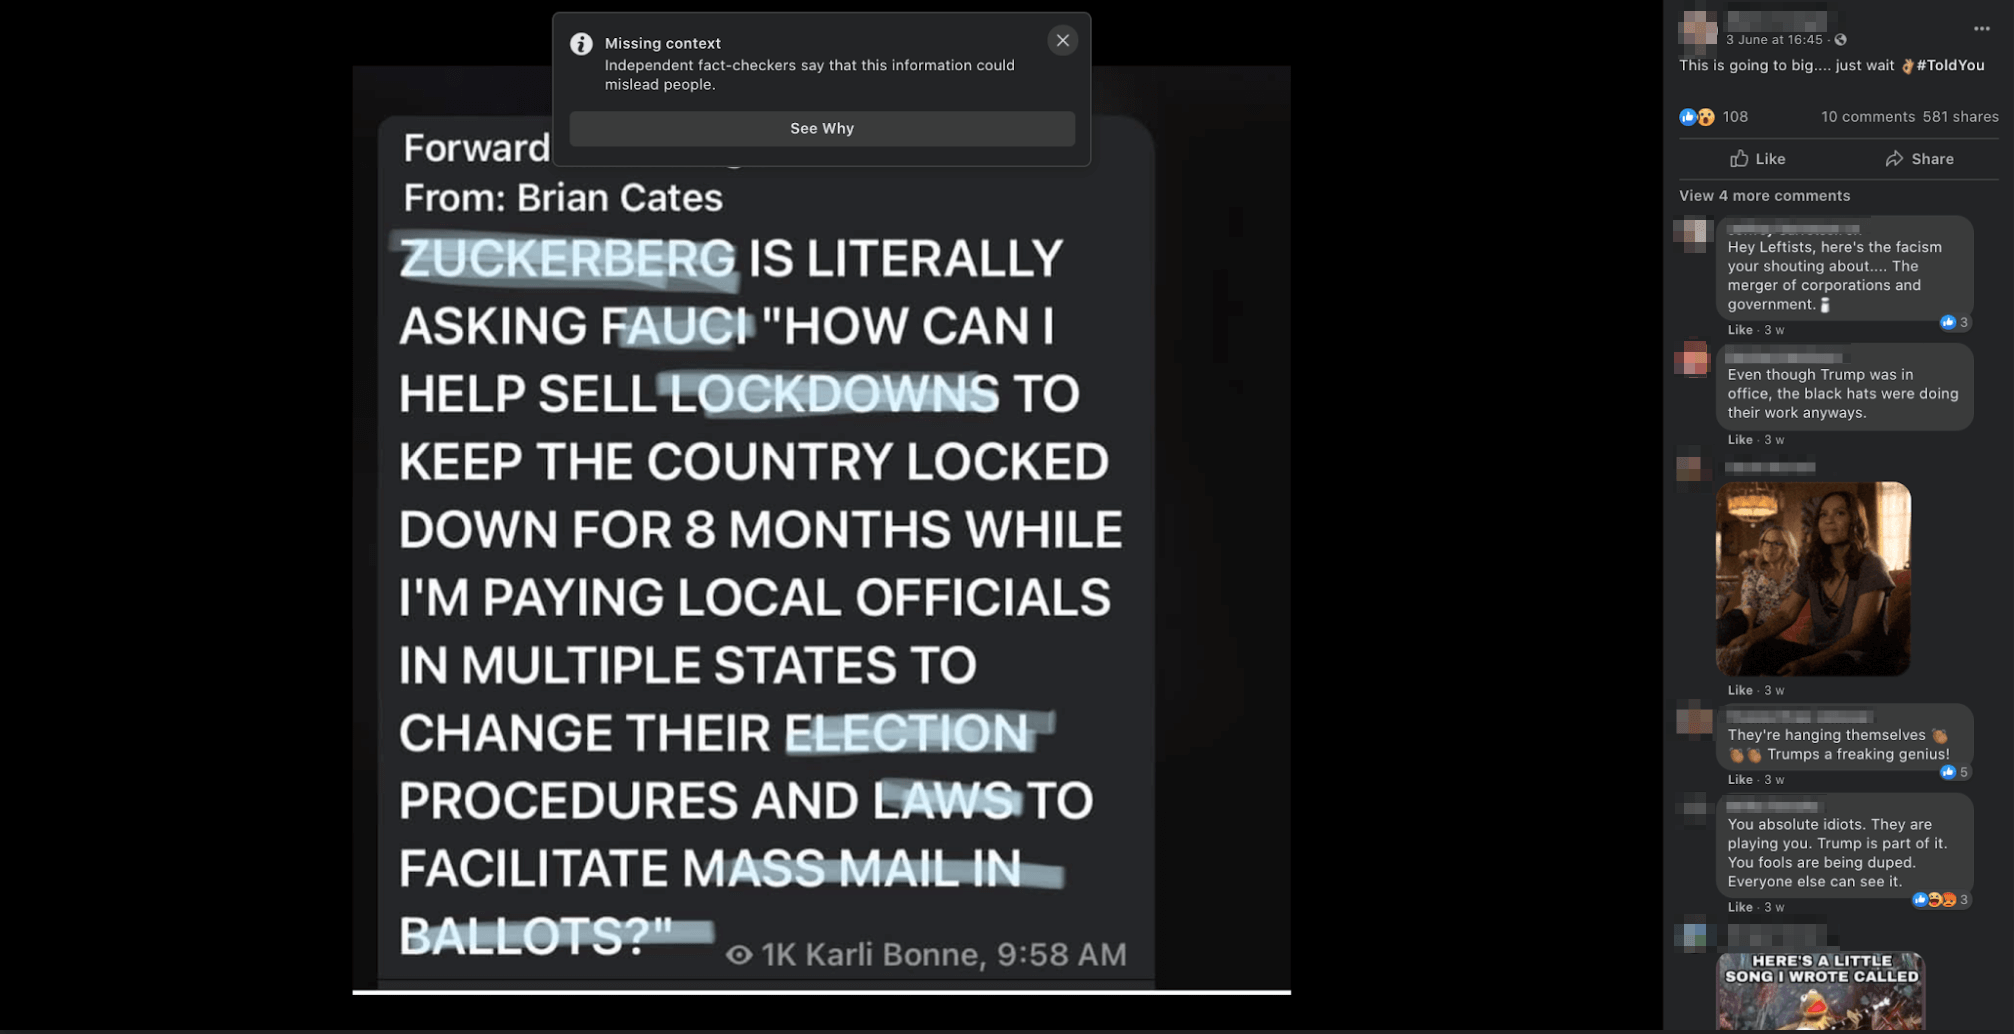
We only included posts when we were able to document at least one occurrence that had been labelled by Facebook but we could also find “clones” or “variants” of the same example that had not been labelled.
With this methodology our team was able to identify a total of 30 posts. The engagement data we estimate for our sample provides some indication of the relative reach of different claims.
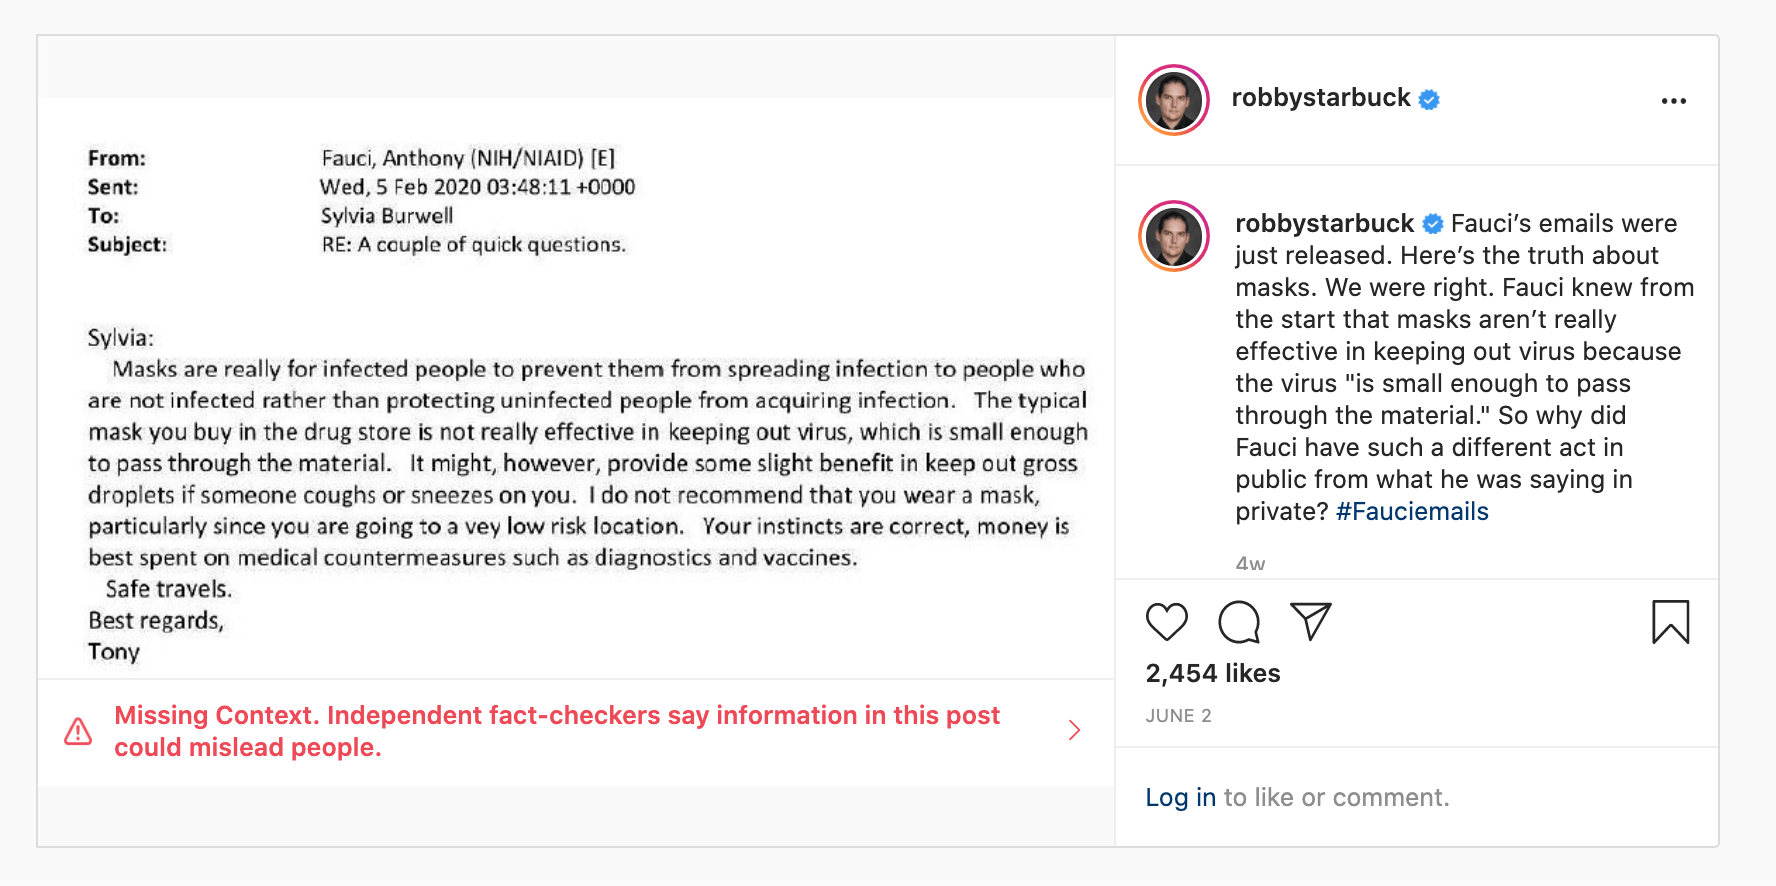
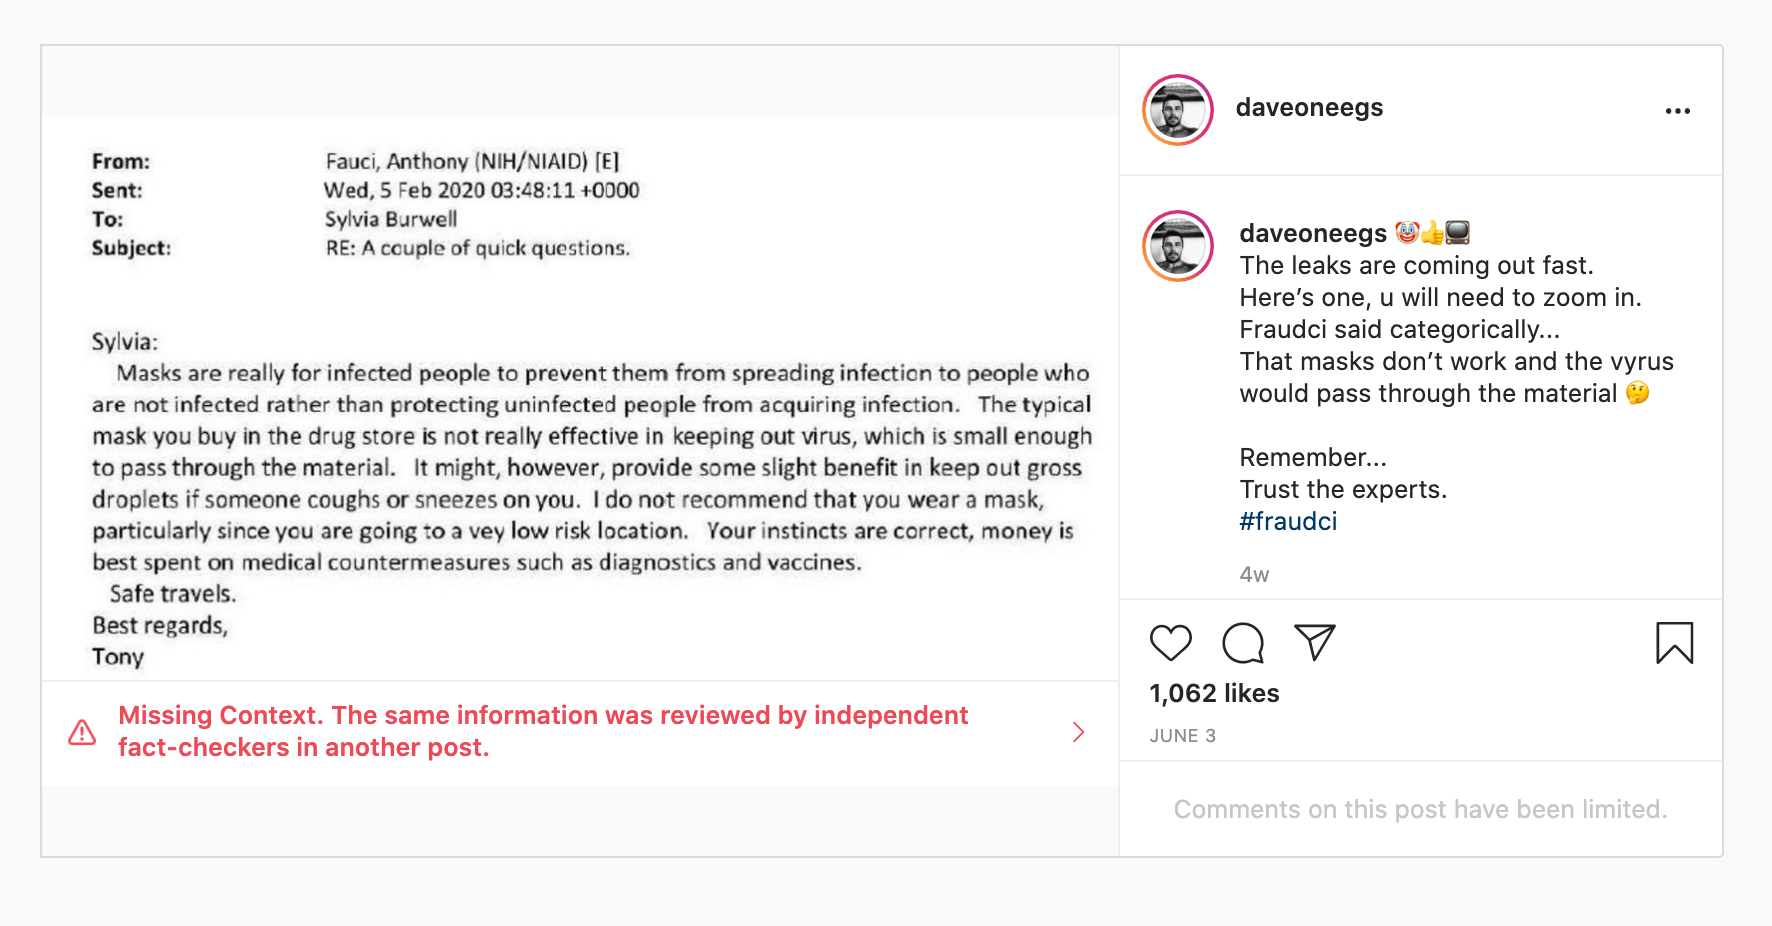
Case study: The ‘Fauci emails’ methodology
Our investigative team conducted a search inputting the “fauci lied” and “fauci emails” keywords into the
CrowdTangle
58
search
application
and examined the top 50 results returned for public groups, pages and verified profiles having shared a publication including the above search terms.
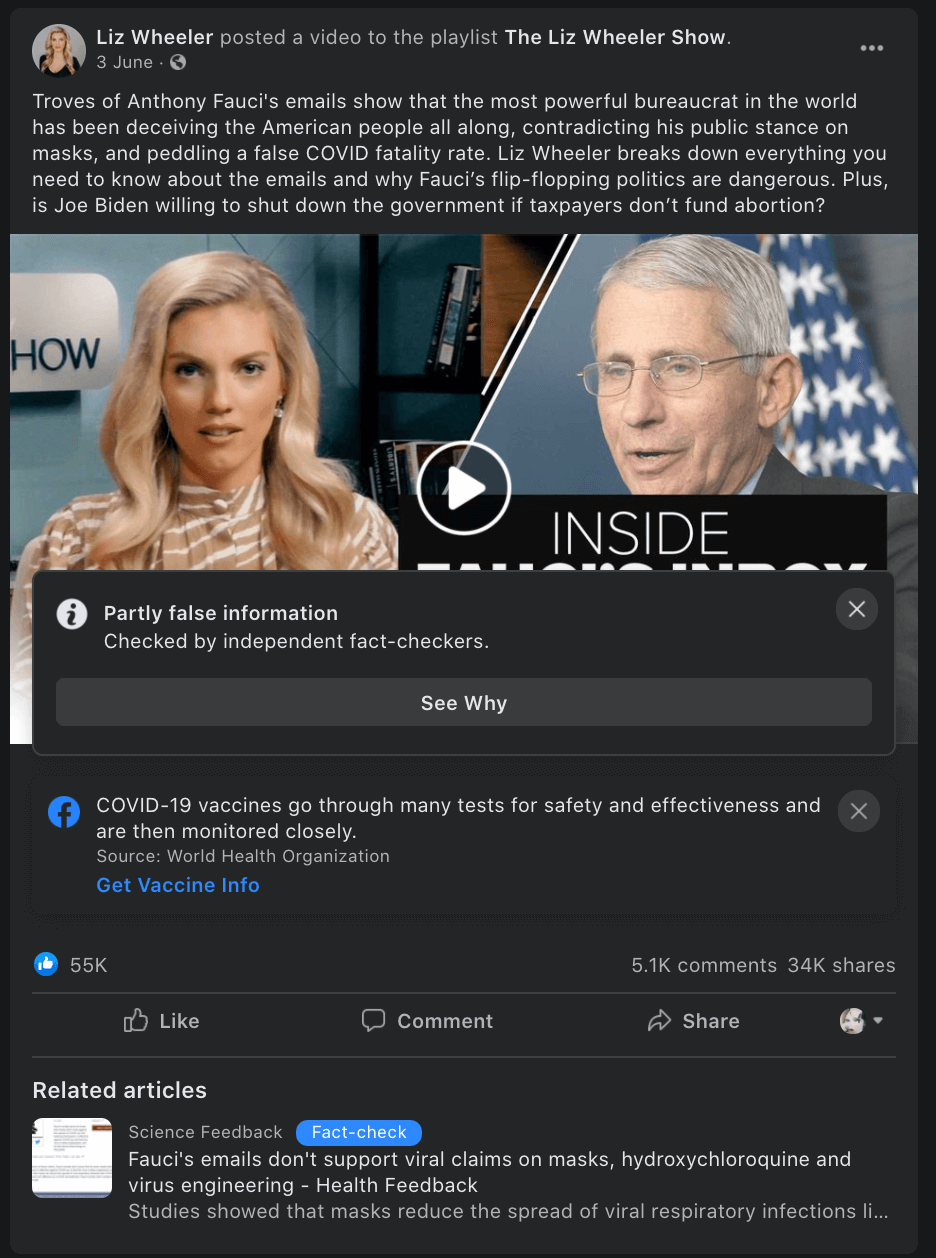
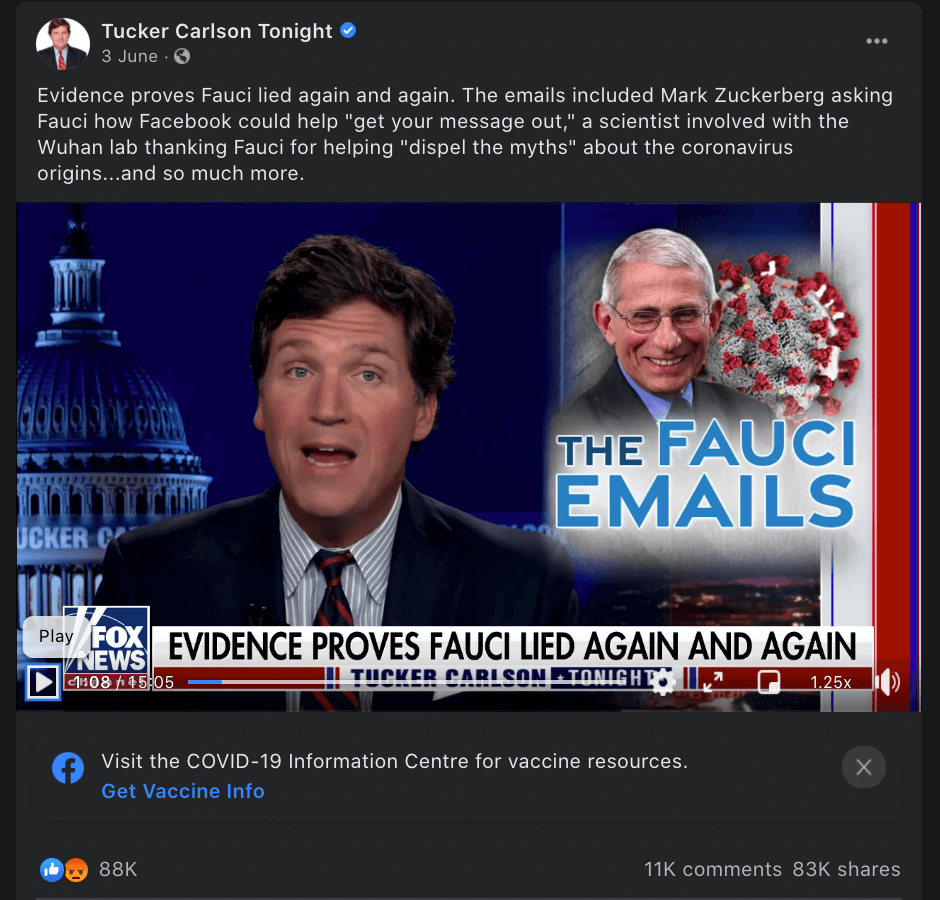
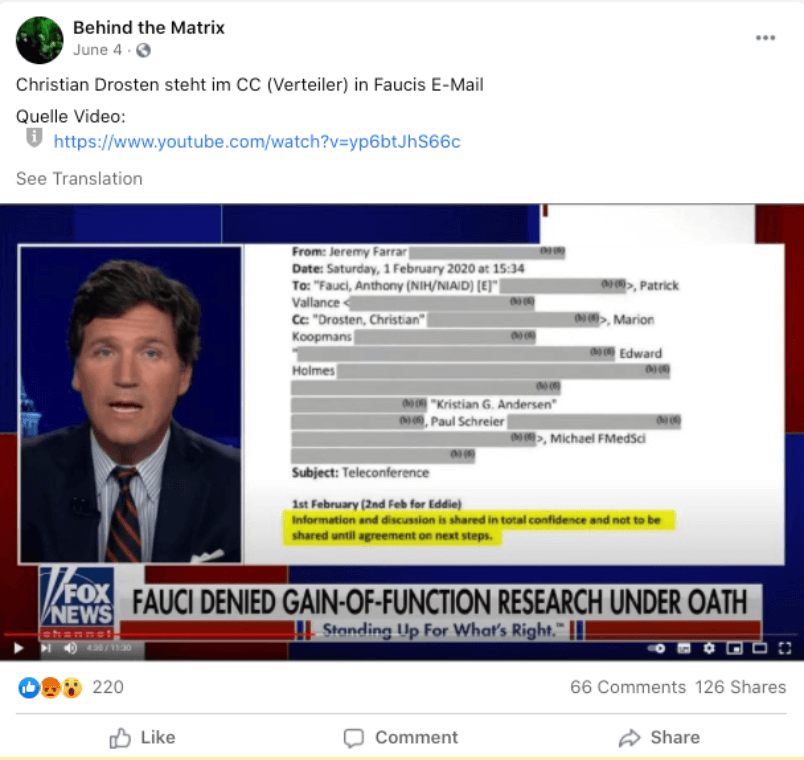
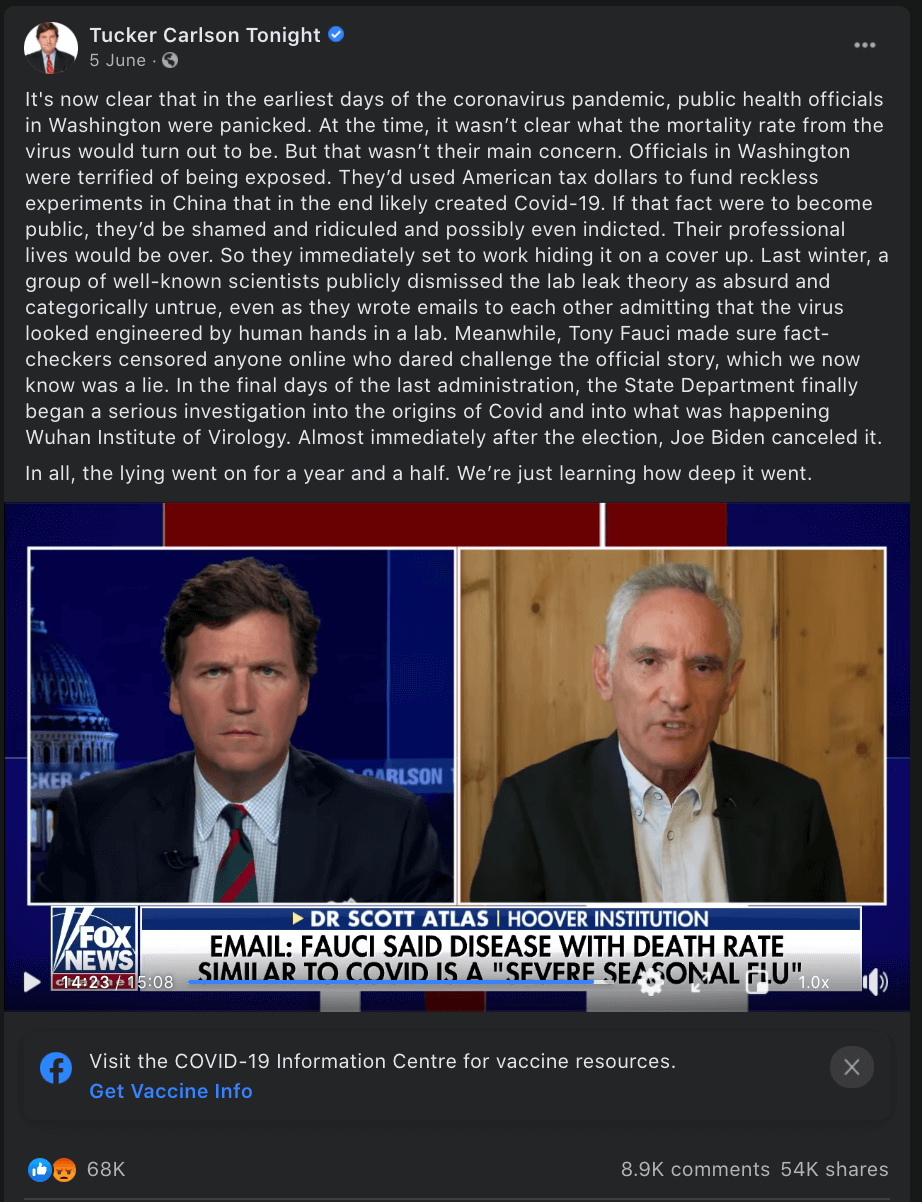
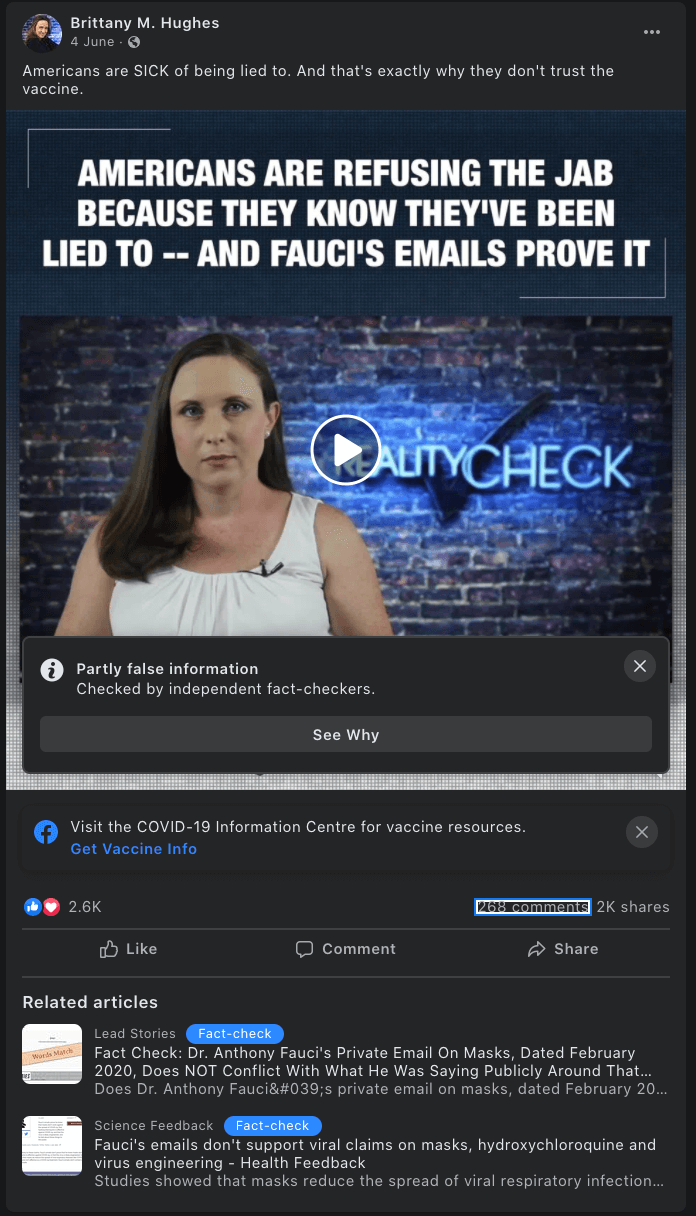
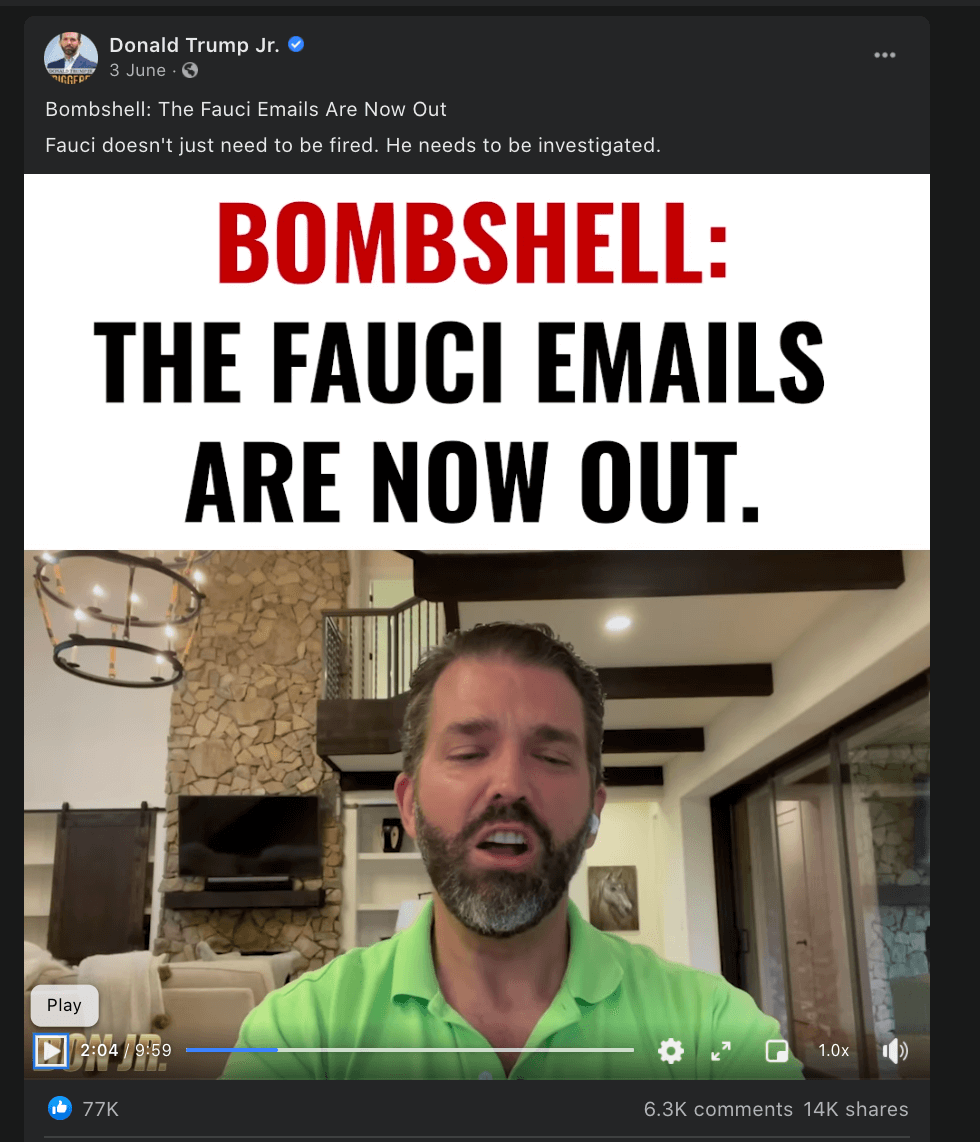
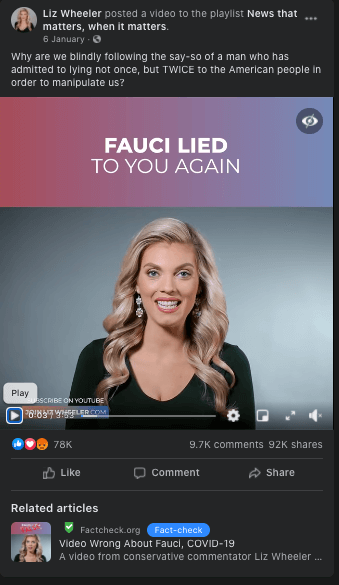
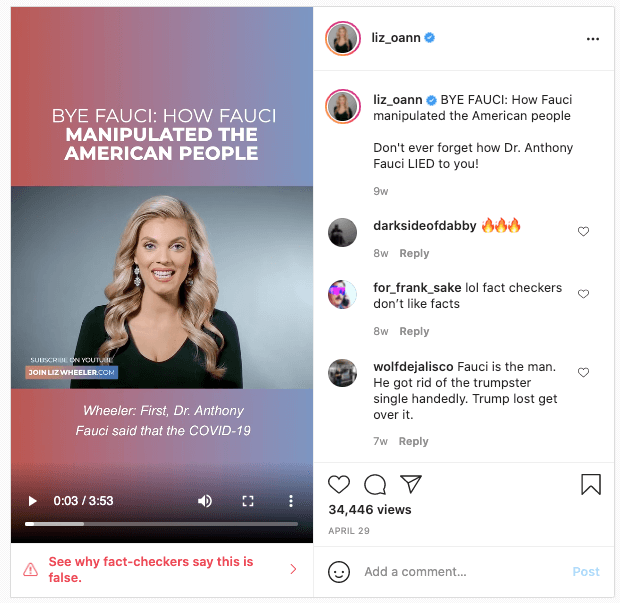
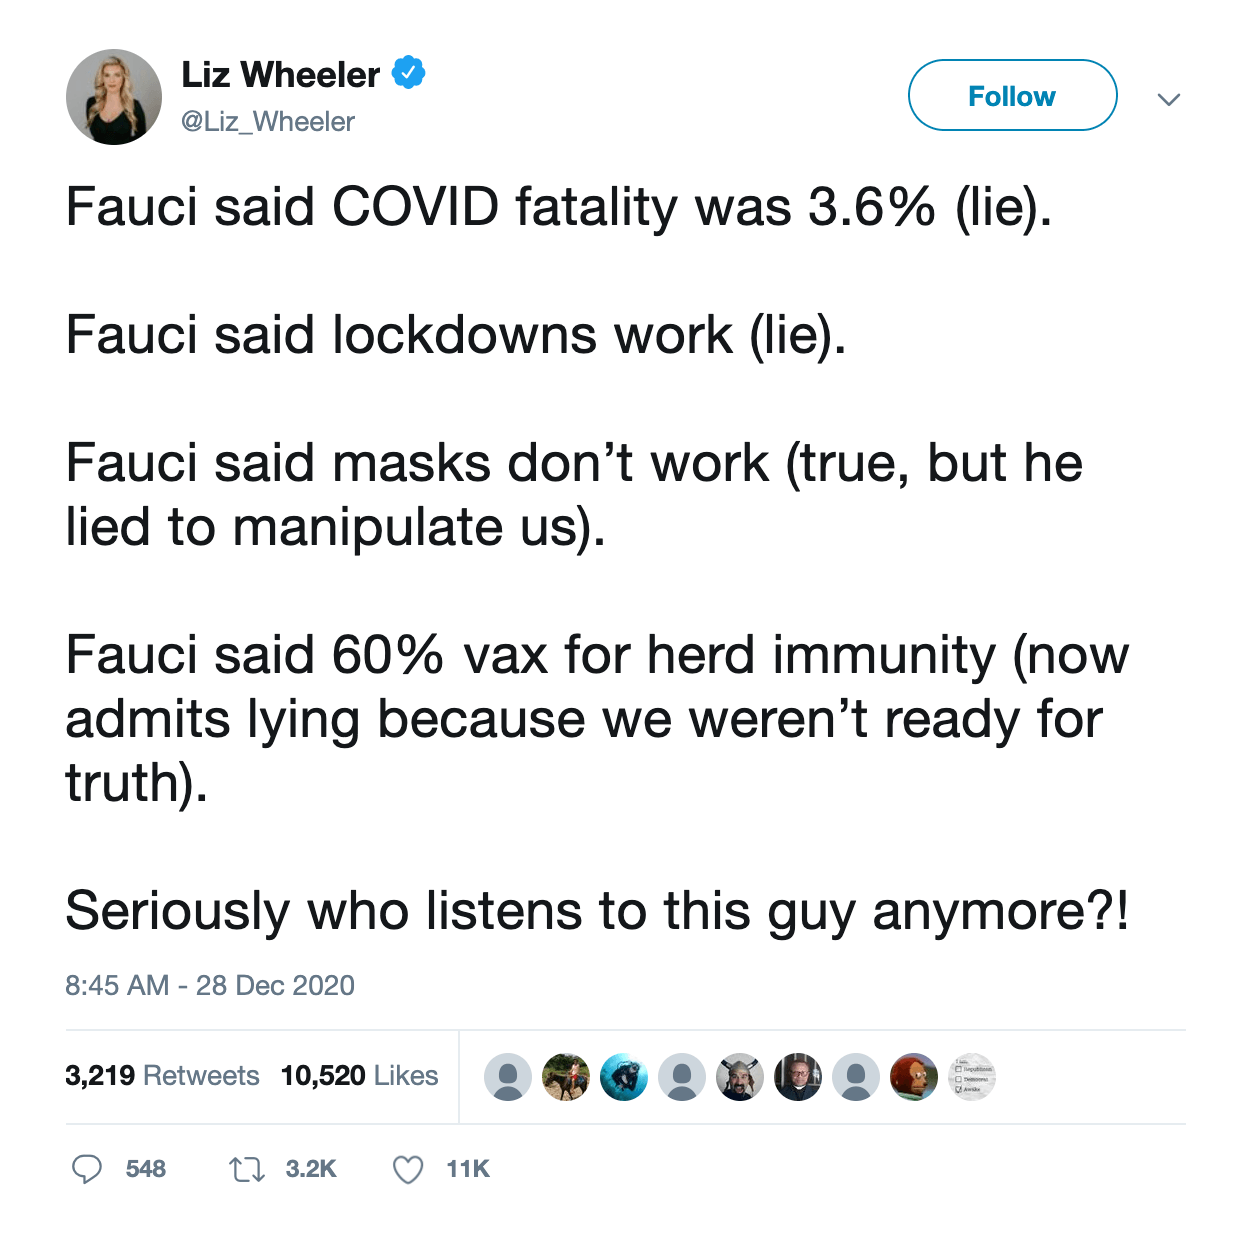
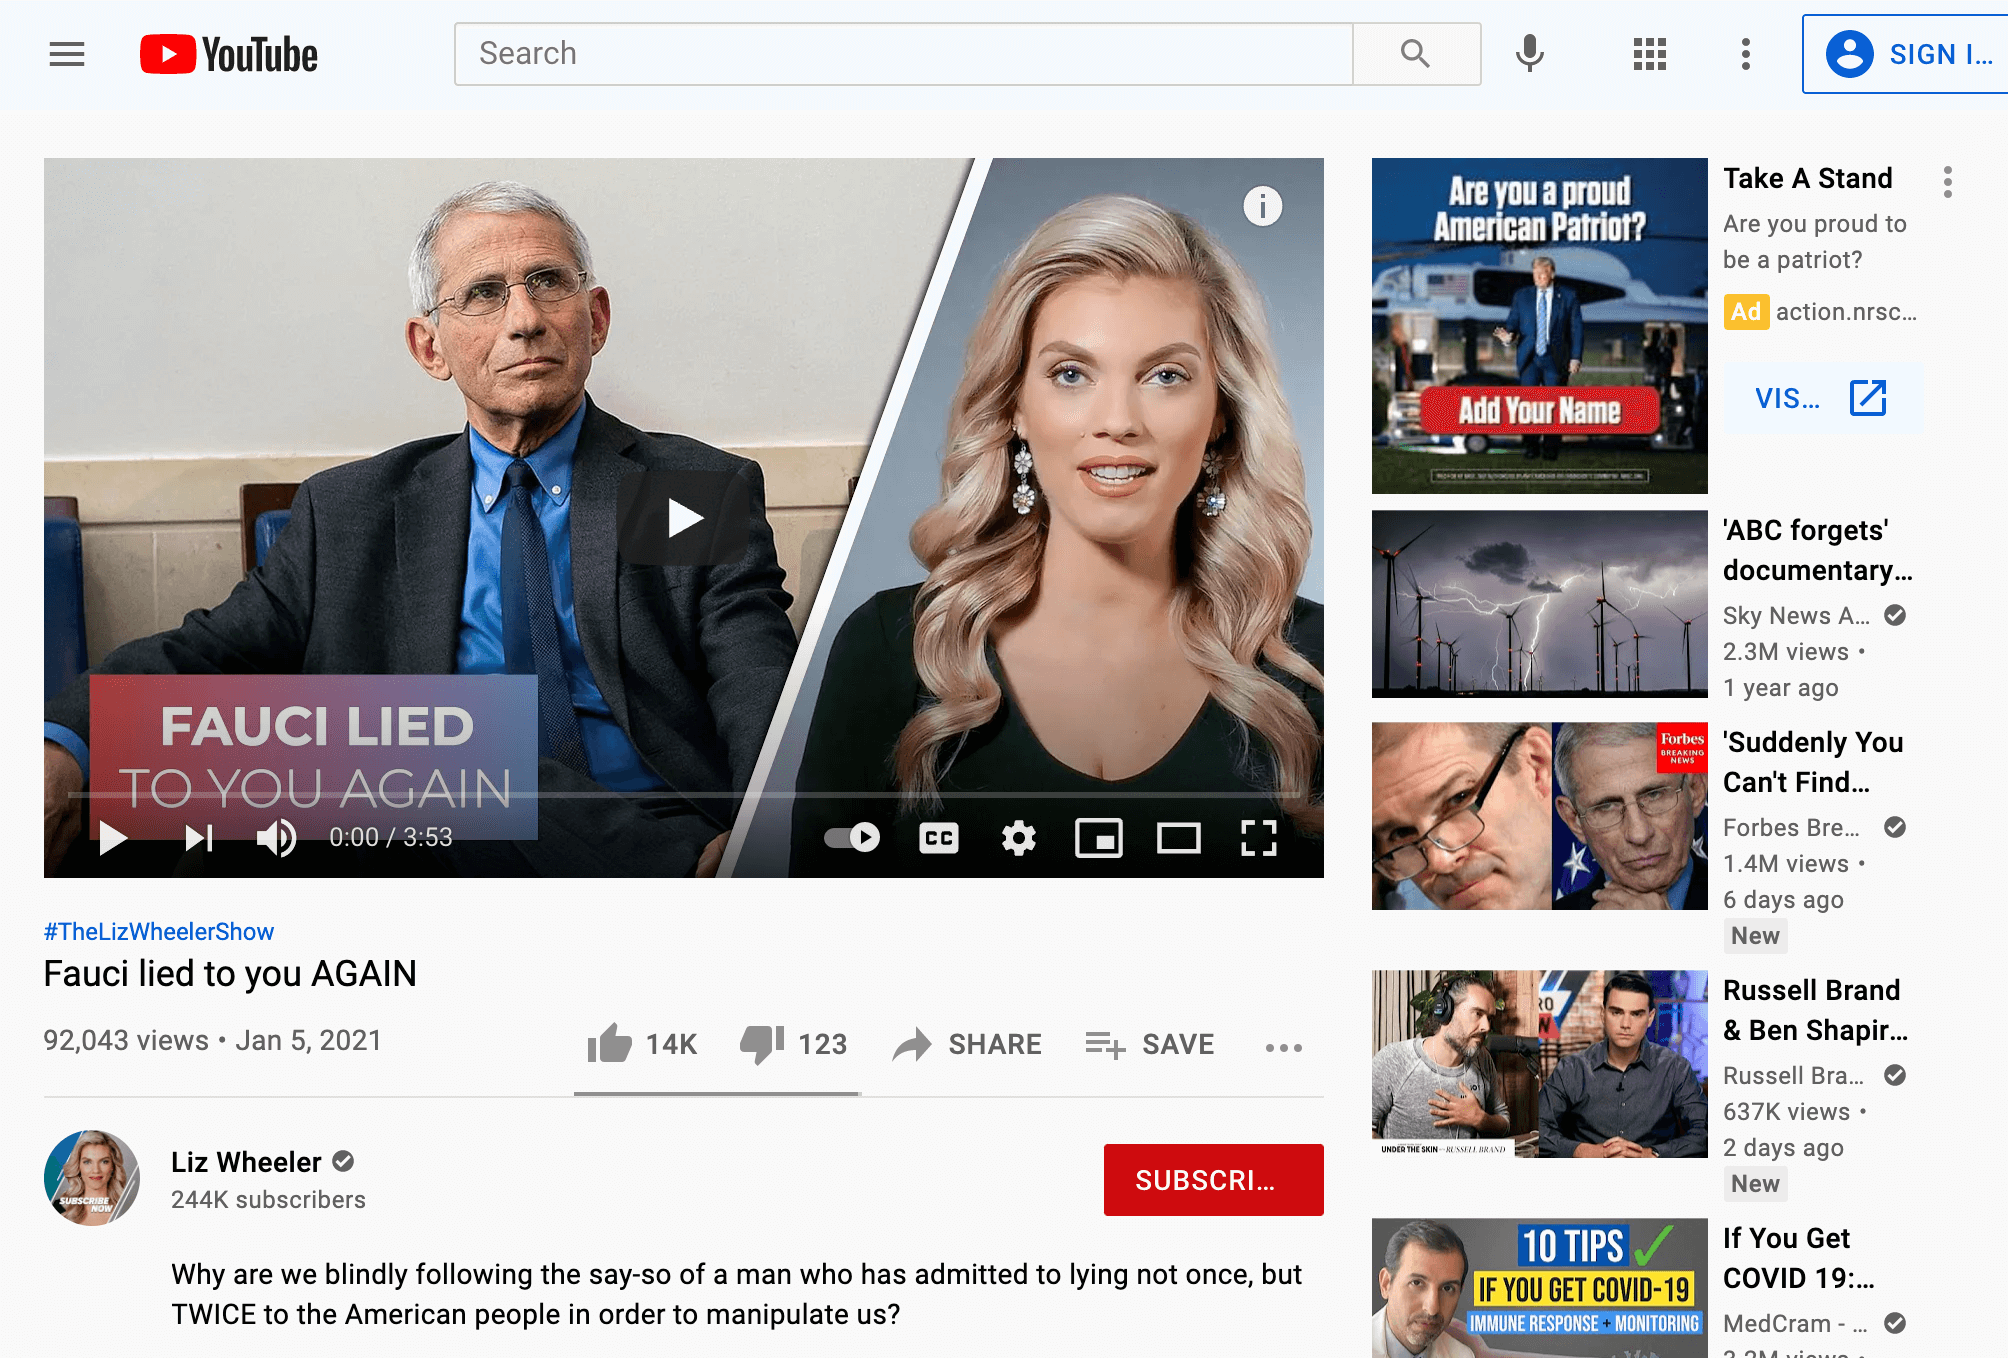
Our team included content containing misinformation narratives claiming Anthony Fauci lied in some email exchanges on issues such as the effectiveness of masks, the origins of coronavirus and the effectiveness of hydroxychloroquine as a treatment for COVID-19 with a primary or secondary fact-check from a Facebook fact-checking partner.
59
The case study research was based around claims referenced in the following five fact-checking articles:
Simple statements or memes where no context or author was provided were excluded.
Section 2: Hate targeted at scientists - a closer look
A torrent of hate in the comments: Methodology
From the database of 85 items targeting the three scientists of this study described in Section 1, Avaaz researchers used the
Export Comments tool
and collected export files displaying all the comments from the three posts having gathered the highest comment counts across the full data set.
60
All three publications gathered a total of 77,012 comments and were videos targeting Anthony Fauci.
We first analysed the overall language of the comments
61
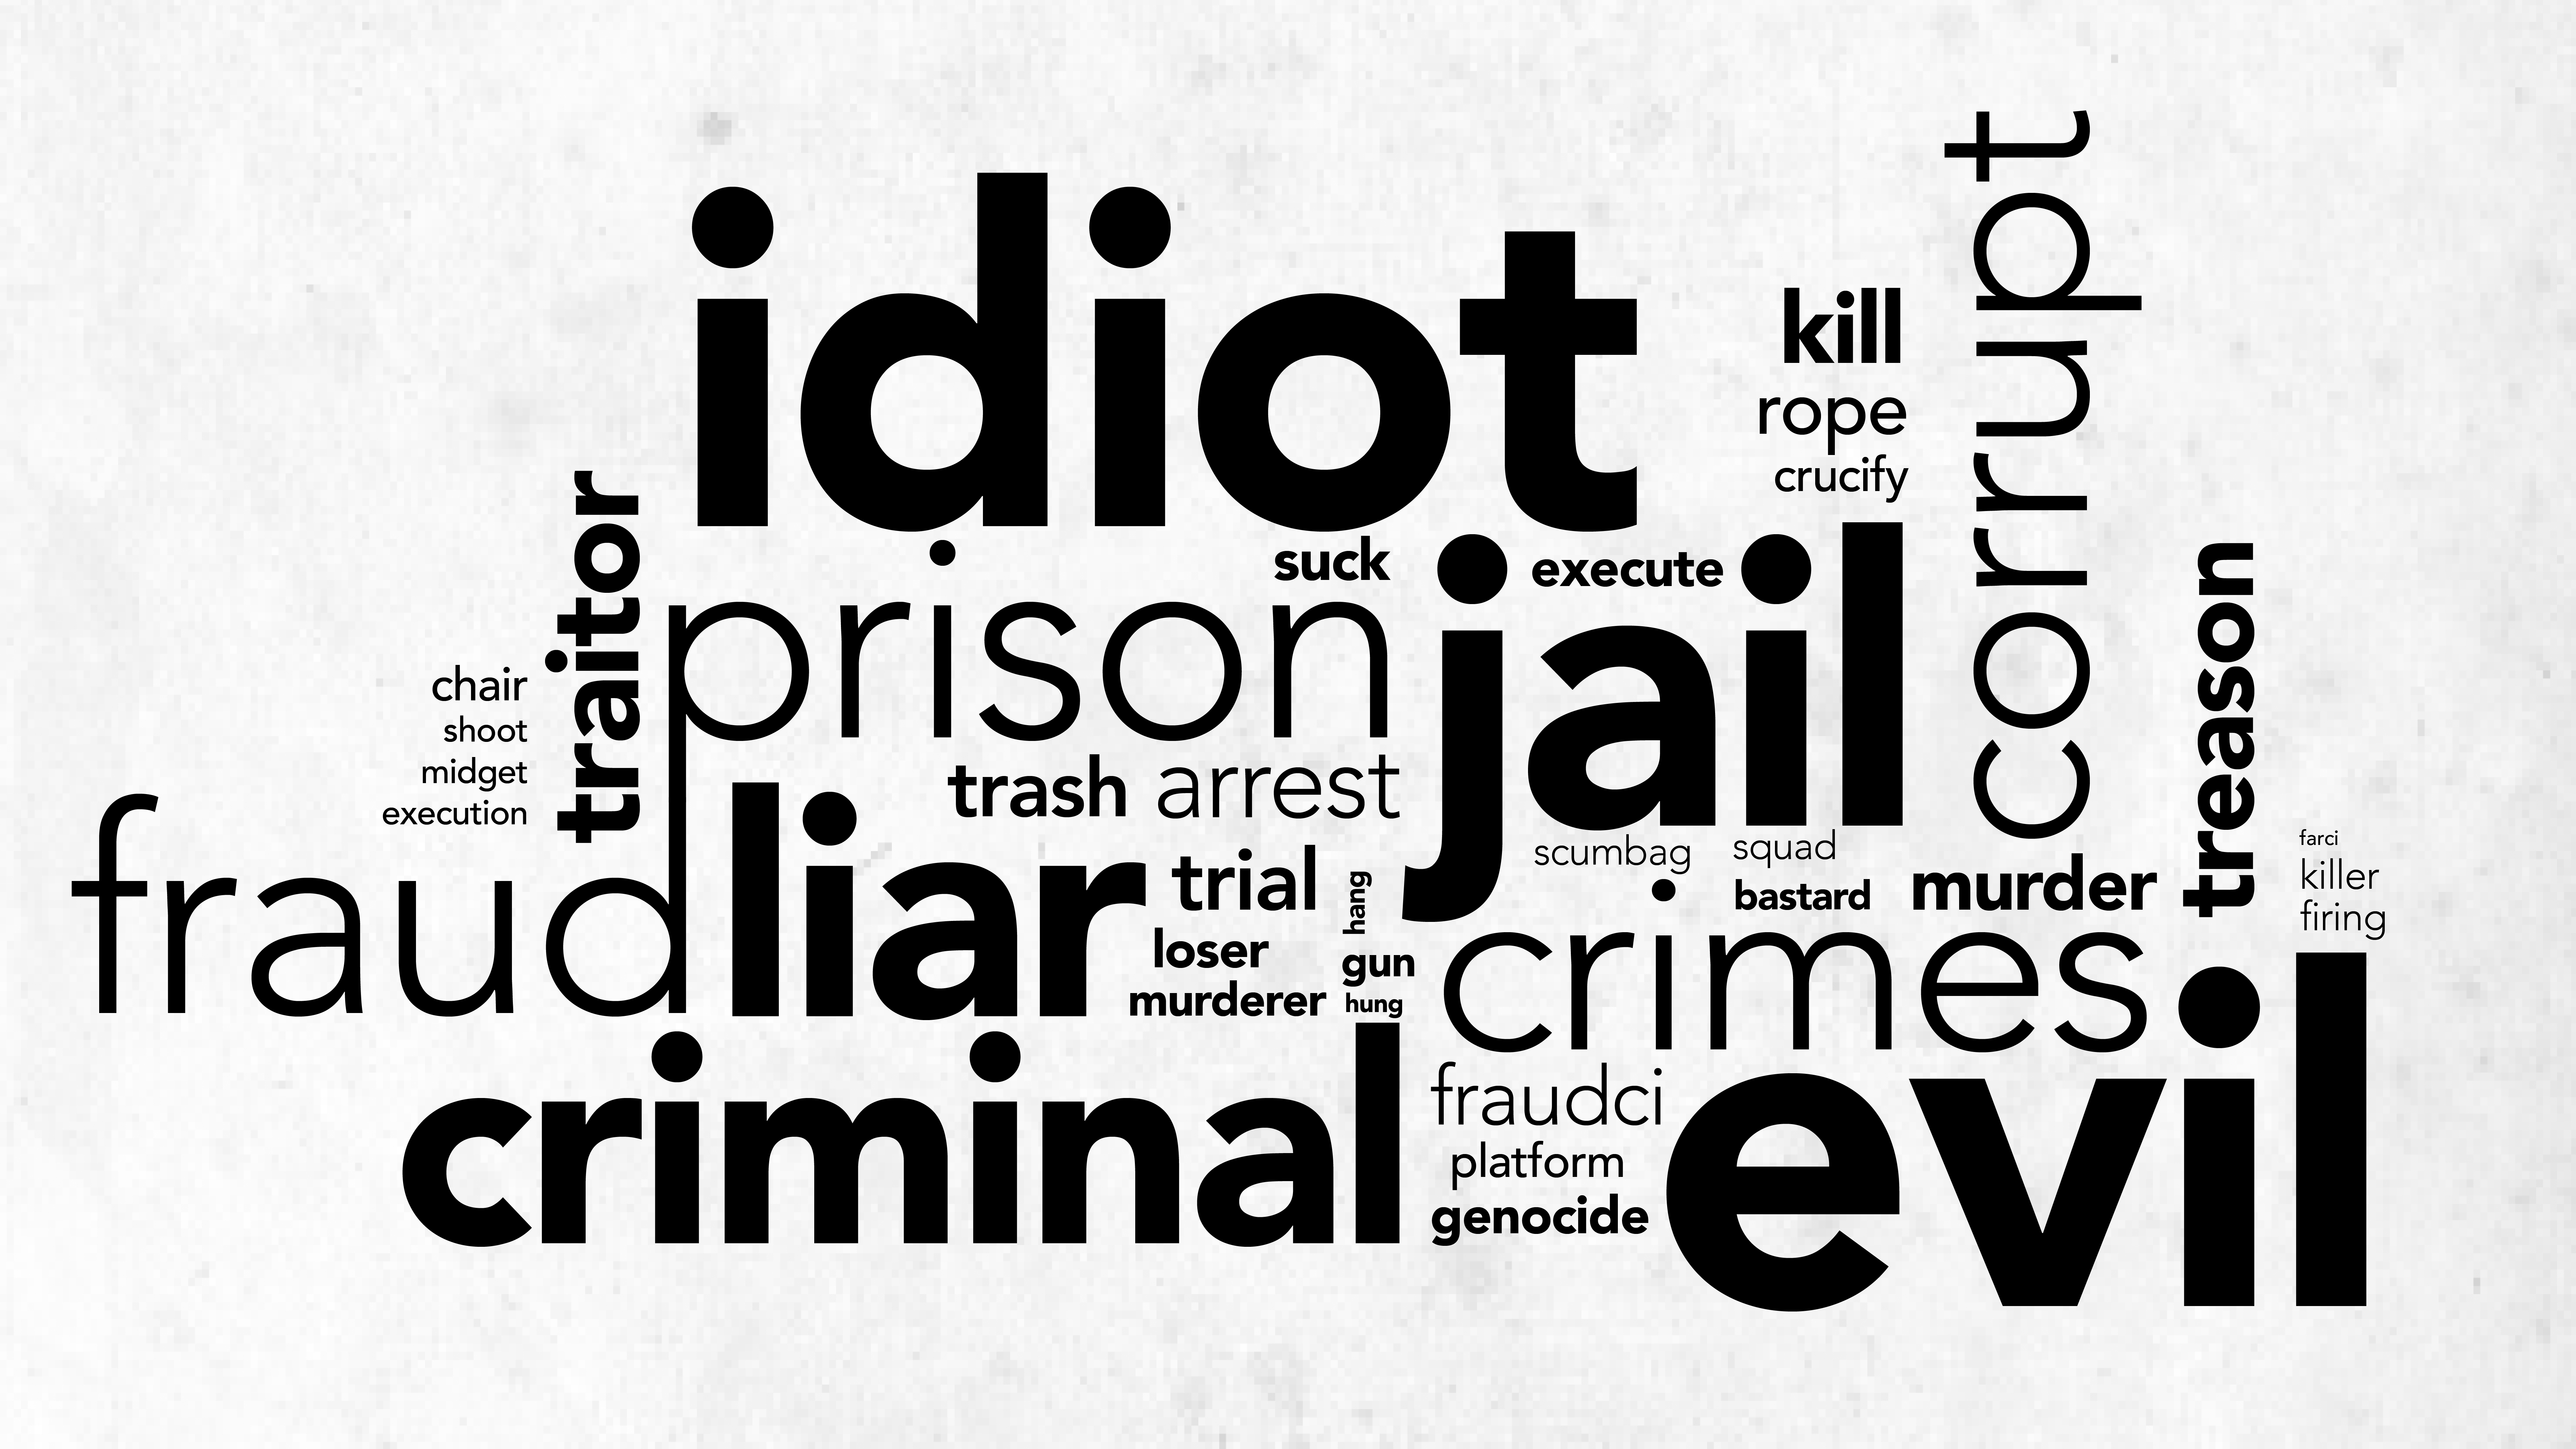
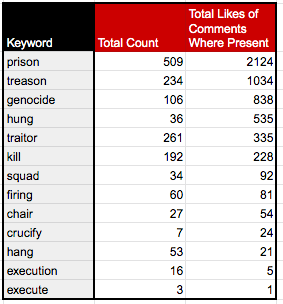
and then we looked for specific, offensive terms sourced from a vocabulary curated by Avaaz researchers.
62
We measured both the total count of comments in which each term of interest occurred, as well as the total count of occurrences of the terms. This allowed us to distinguish between comment topics and term emphasis. The understanding here is that the more often a term is repeated within a comment, the more emphasis it is being given.
To eliminate terms that do not offer any contextual value but are repeatedly used throughout communication, we employed a common practice of removing stop words. Stop words include articles, interjections, pronouns, etc. More details are provided in the Technical Appendix of this report.
Twitter hashtag campaigns: Methodology
During the research process, the Avaaz team noticed some hashtags were recurring in the misinformation posts identified in the fact-check articles documented following the methodology described in Section 1.
Using the online monitoring software
Meltwater
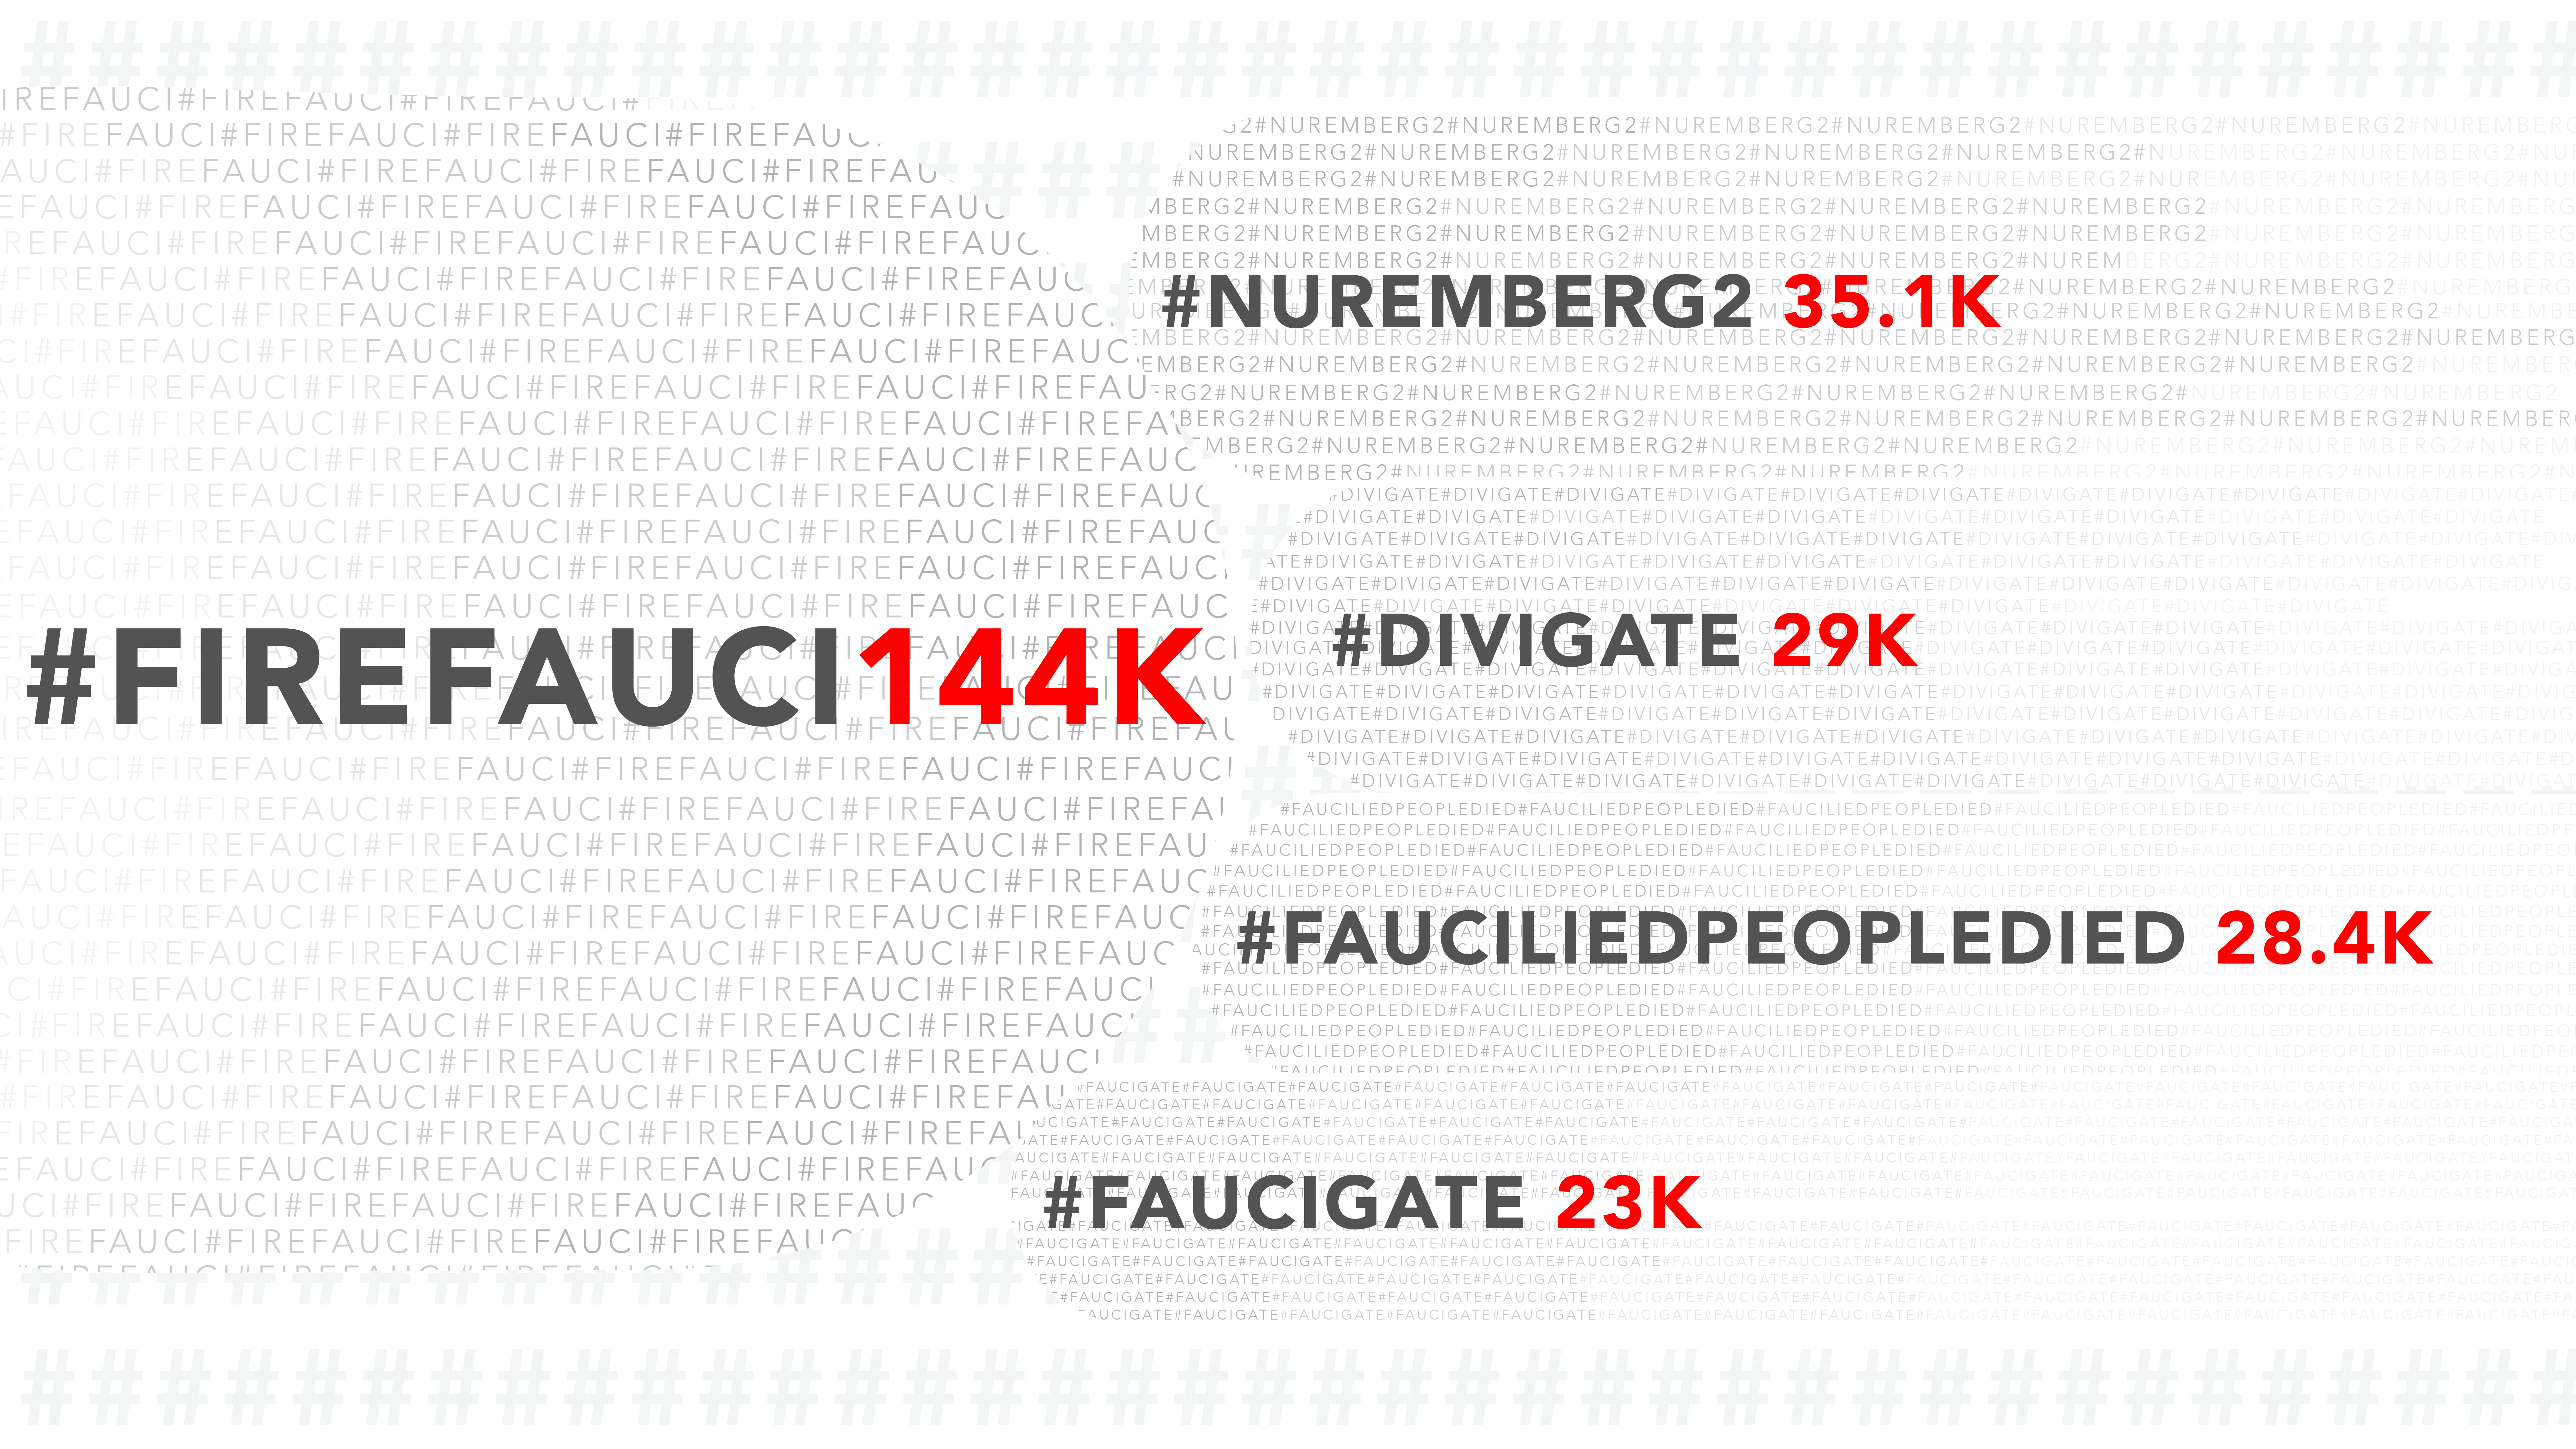
, Avaaz took a closer look at 13 Twitter hashtags to understand the magnitude of the potential trend between January 1, and June 30, 2021.
The team collected the occurrences count for each of the following:
-
#FireFauci: 144,000 counts
-
#Nuremberg2: 35,100 counts
-
#Divigate: 29,000 counts
-
#FauciLiedPeopledied: 28,400 counts
-
#Faucigate: 23,000 counts
-
#FauciLied: 9,207 counts
-
#Nuremberg2021: 8,326 counts
-
#ArrestFauci: 7,691 counts
-
#EpidemischeLuege: 3,778 counts
-
#FraudFauci: 3,288 counts
-
#FauciForPrison: 1,350 counts
-
#FuckFauci: 917 counts
-
#DrostenGate: 505 counts
Section 3: Online coverage and sentiment analysis
Identification of the online coverage: Methodology
As part of this research, Avaaz used the social media monitoring tool
Buzzsumo
to look into the top 500 articles mentioning any of the three scientists and shared on Facebook between January 1, and June 30, 2021.
We queried the following seven keyword searches in Buzzsumo’s web content analyser tool and collected the first 500 results, sorted by most interactions gathered on Facebook during the research time frame stated above:
-
Anthony Fauci
-
Fauci
-
Christian Drosten
-
Drosten
-
Marc Van
-
Ranst
-
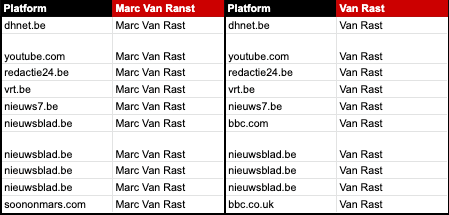
Van Ranst
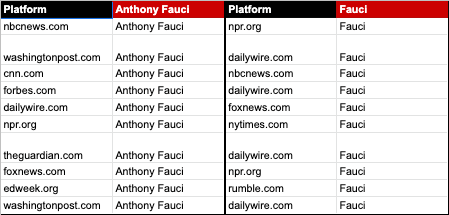
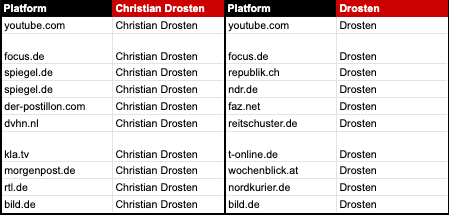
Counting the top articles up to a maximum of 500 results, for each scientist surname then name and surname, the original sample is of 3,000. As some article titles were showing up both in the top 500 for the scientists name and again in the results for the scientists name and surname, 2,508 is the final article count after deduplication of results.
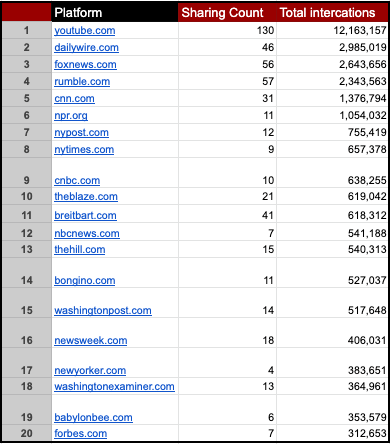
The top 20 outlets
63
that published articles about any of the three scientists present in this study by referring to them using their full name or surname only, was established by sorting the full list by most interactions received across Facebook, Twitter, Pinterest and Reddit as provided by Buzzsumo and by keeping the first 20 results.
Outlets known for spreading misinformation: Methodology
In order to find fact-checking articles that referred to claims made by major news outlets such as Fox News, CNN and MSNBC (the parent company of NBC News and CNBC), we included in our search the names of presenters of the top three news programmes at each outlet. This was necessary because fact-checkers sometimes refer to presenters or reporters by their names in fact-checking articles, without necessarily mentioning the news organisation that employs them.
To obtain the data from an independent source about the top news programmes at these outlets, we used viewing figures from the rating agency
Nielsen,
originally published by Adweek. Adweek regularly posts various weekly, monthly and quarterly TV ratings, using
Nielsen’s data.
Adweek also publishes Nielsen’s raw ratings data files embedded in their articles through
Adweek’s Scribd page.
For this research we used Nielsen’s news show ranking data from Q2 of 2021, as published by
Adweek.
As a result, our search for fact-checking articles include the following three news shows and their presenters:
-
Fox News
-
Tucker Carlson Tonight - Tucker Carlson
-
Hannity - Sean Hannity
-
The Five - Dana Perino, Greg Gutfeld, Jesse Watters
-
CNN
-
Cuomo Prime Time - Chris Cuomo
-
Anderson Cooper 360 - Anderson Cooper
-
Erin Burnett Outfront - Erin Burnett
-
MSNBC
-
Rachel Maddow Show - Rachel Maddow
-
The Last Word with Lawrence O’Donnell - Lawrence O’Donnell
-
All In with Chris Hayes - Chris Hayes
When searching for fact-checking articles, we used BuzzSumo’s web content search engine and Google’s site search method to specifically search for content published by Facebook’s official
fact-checking partners.
Terms for these searches either contained the names of these organisations, or in the case of major TV channels, either the names of the organisations, or the names of their top three news programmes, or the names of the hosts of these programmes.
Technical Appendix
Sentiment Analysis
Avaaz ran a simple “sentiment analysis” using the database of 2,508
64
article titles retrieved by the process described in Section 3. We used a pre-trained algorithm for sentiment analysis. This means that the language index in the algorithm's library is generalised without any specific context. This may justify tuning and optimisation attempts, as our data is contextualised within media and journalism, specifically in politics and medical science.
Our analyses use a pre-trained library provided by NLTK (Natural Language Processing Toolkit), which leverages a sentiment analysis module called Vader. The Vader sentiment analysis algorithm provides polarity scores, which score text data for sentiment affinities. The algorithm assigns scores based on a predefined dictionary, with the additional contexts of capitalisation, punctuation, etc. The library is developed for the English language. Thus, in order to apply sentiment analysis to non-English content, we first have to translate the content to English. This is achieved by first auto-detecting the language of the content, then using a python module that leverages Google Translate to translate the content to English. Once the content has been translated, the Vader library provides the polarity scores in the standard fashion. It is possible that this also had an impact on the comparatively surprising results for Marc Van Ranst.
There are three separate affinity scores provided, including negative, neutral, and positive, as well a fourth compound score which provides an overall sentiment score between -1 and 1. A negative compound score corresponds to a negative sentiment while a positive compound score corresponds to a positive sentiment.
Sentiment to Interaction Count (IC) Correlations
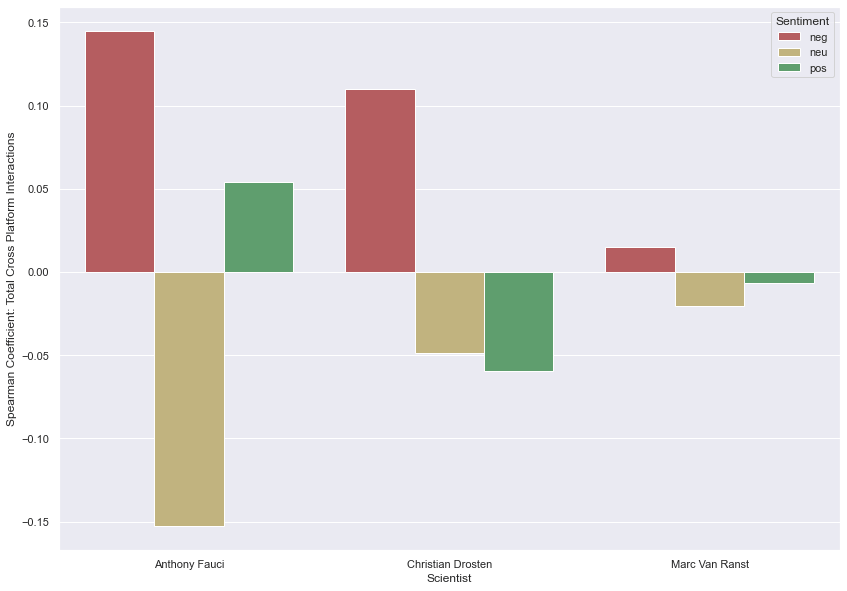
For each sentiment score component, we compute correlation coefficients with platform interaction counts. We calculated these correlations with two different measures: the Pearson coefficient and the Spearman coefficient. Unlike the Pearson coefficient, the Spearman coefficient is not constrained by linear relationships between variables. As long as both variables move in relative position with one another (i.e., are monotonic in relation), they are treated as being correlated.
The Spearman coefficient appeared to better capture signals in our dataset, which supports our general intuition about the data: On social media platforms, the more emotive content is, the more inclined users are to interact with it. The relationship between emotive content and interaction counts may not necessarily be linear, but overall move in relative step with one another.
We also explored the relationship between the sentiment of article headlines and their total cross platform interactions. This was achieved by classifying headlines by sentiment, then calculating correlation scores between each sentiment class.
Media Outlet and Author Breakdowns
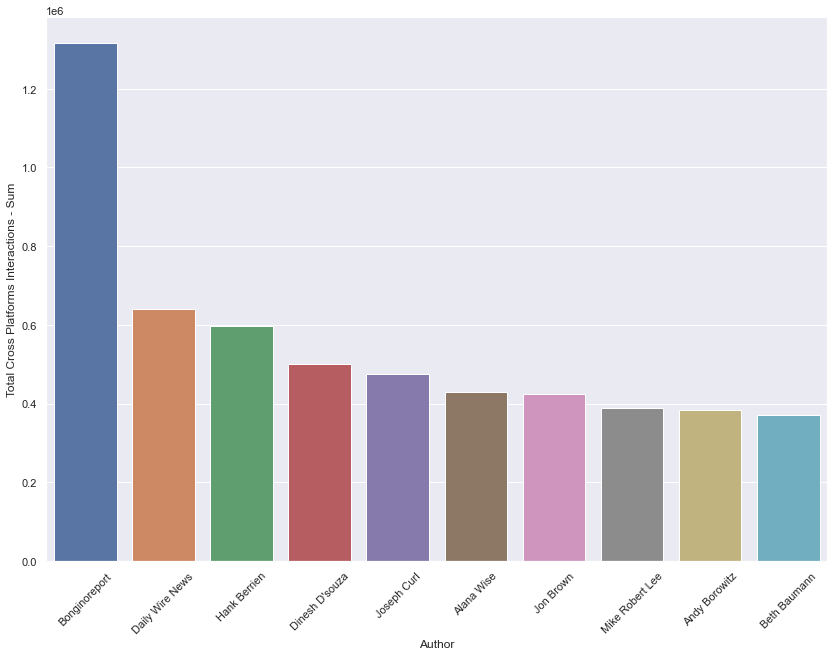
Next, we explored interactions among the top media outlets and authors. This is approached by identifying the top 10 sources in terms of total cross-platform interactions. We then compare the total interactions with average interactions per source. This allows us to analyse sources in terms of overall impact and average content interactions. Likewise, we measure total sentiment component scores and average sentiment component scores to analyse the general sentimental skew of headlines by source.
Anthony Fauci
The Spearman method suggests the strongest correlation measure exists between negative scores and total cross-platform interactions.

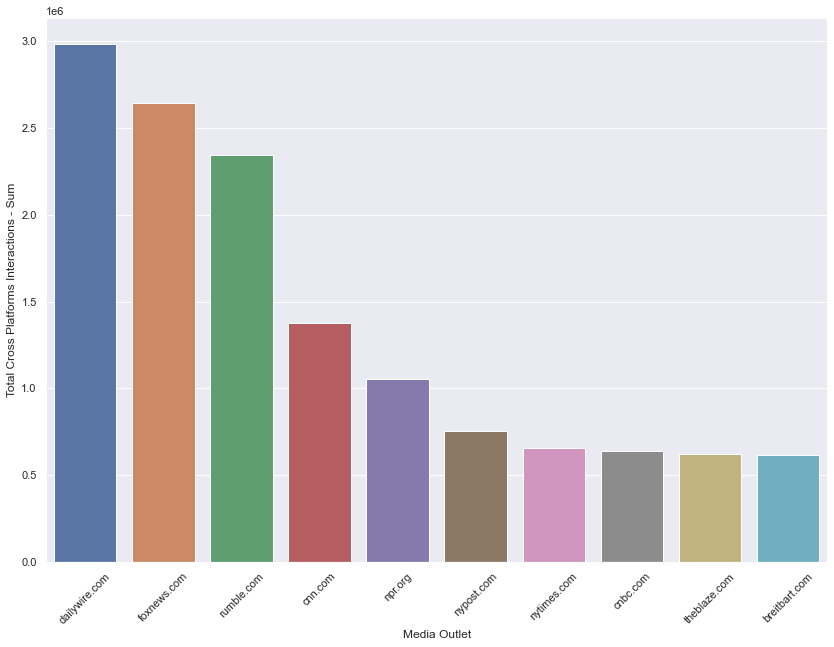 Figure 1: Total cross-platform interactions by media outlet - Anthony Fauci
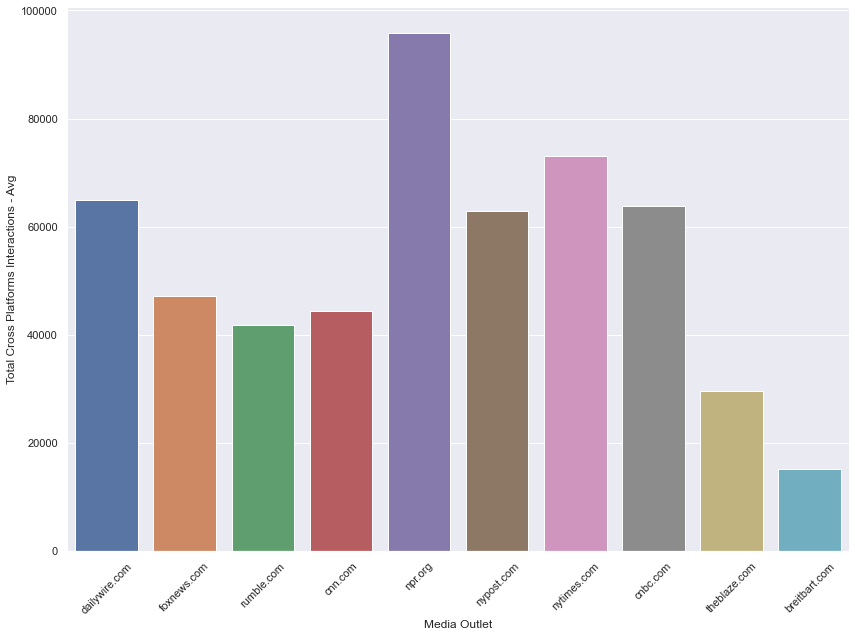 Figure 2: Average cross-platform interactions by media outlet - Anthony Fauci
The top three media outlets that dominate in total cross-platform interaction counts across all of the content captured in this dataset tended to get less interactions per article than some of the other top media outlets. This may suggest that total cross-platform interactions amassed by the top three media outlets are done so by the quantity of the articles they are producing, more so than the popularity of the individual articles themselves.
While sentiment scores of individual headlines from the top media outlets usually don’t veer too far from neutrality, the sums of their scores tend to skew towards negative sentiment.
Christian Drosten
Once again, using the Spearman method,
the strongest correlation measure exists between negative scores and total cross-platform interactions.

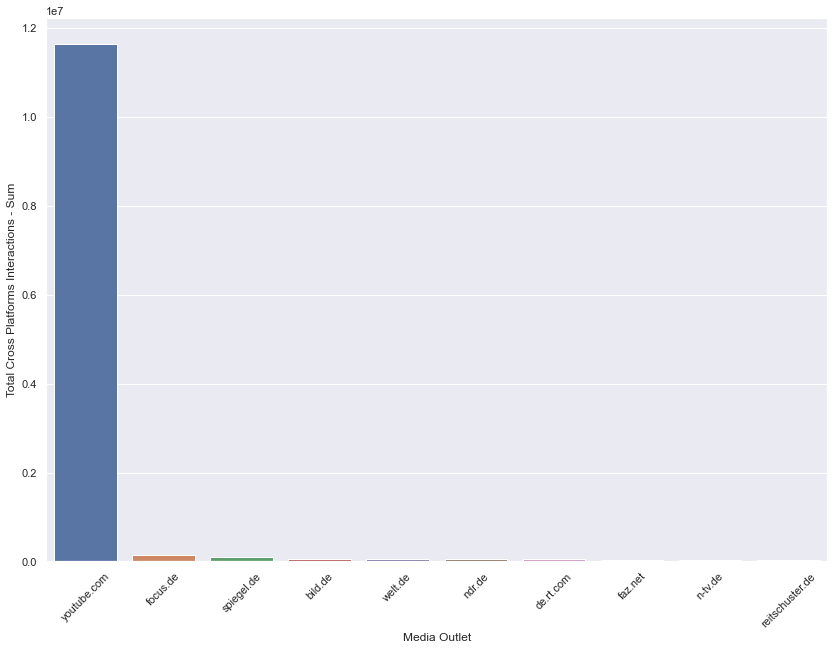 Figure 1: Total cross-platform interactions by platform and media outlet - Christian Drosten
Marc Van Ranst
The strongest positive correlation measure exists between negative scores and total cross-platform interactions. This is consistent with what we observed for the previous two scientists. However, these results differ in that the range of sentiment scores is smaller. This lack of variance made subsequent analyses more challenging.

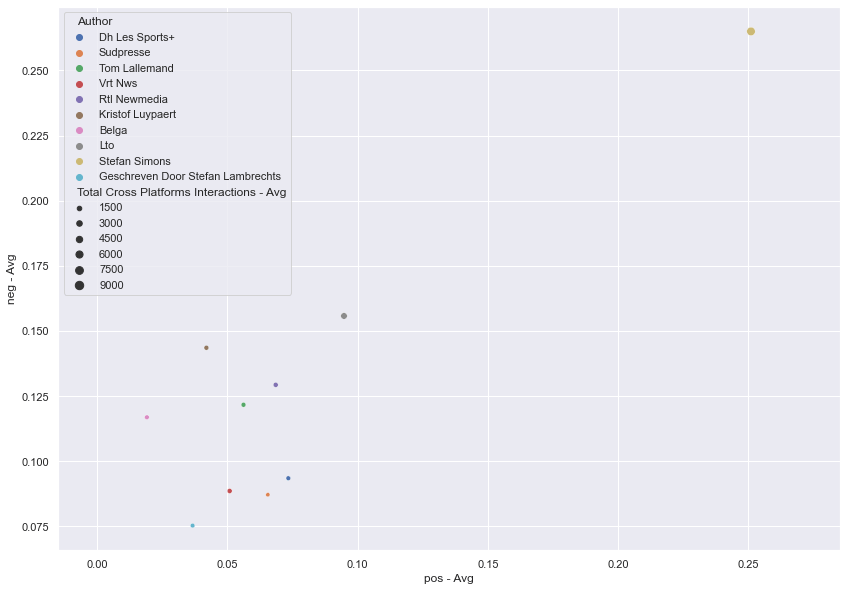 Figure: Average sentiment polarity scores by author
However, source breakdowns by both media outlet and author generally skew negative in sentiment.
Correlations
Our analyses also make use of correlation scores (often denoted as r), which measure the interdependent relationship between two variables. Initially, we used the Pearson coefficient but ultimately found that the Spearman coefficient better captured the signals in the data. All correlation scores are bounded between -1 and 1. Here are some key considerations for interpreting correlation coefficients from
www.jmp.com:
-
The closer r is to zero, the weaker the linear relationship.
-
Positive r values indicate a positive correlation, where the values of both variables tend to increase together.
-
Negative r values indicate a negative correlation, where the values of one variable tend to increase when the values of the other variable decrease.
-
“Unit-free measure” means that correlations exist on their own scale: In our example, the number given for r is not on the same scale as either elevation or temperature. This is different from other summary statistics. For instance, the mean of the elevation measurements is on the same scale as its variable.
It’s also worth noting that there’s a popular saying in statistics: “Correlation does not imply causation”. This means that just because two variables are correlated, that does not mean one causes the other. This principle should be kept in mind when interpreting the results.
Vocabulary Analysis
In our analyses, we use a natural language processing technique called vectorization, which simply counts the occurrences of individual words with respect to each “document”. In this case, “document” refers to each individual comment.
Before tallying, we imposed a lower threshold for term occurrence of 2, meaning that we would only count term occurrences if the term appeared more than once. This decision was premised on filtering out noisy terms such as random URLs and other types of spam content. We also used a case-insensitive approach in order to collapse effects from casing.
General Note on Methodology
It is important to note that, while we collect data and compute numbers to the best of our ability, this analysis is not exhaustive as we looked only at a sample of fact-checked misinformation posts in five languages.
65
Moreover, this research is made significantly more challenging because Facebook does not provide investigators with access to the data needed to measure the total response rate, moderation speed, number of fact-checks and the amount of users who have seen or been targeted with misinformation.
We hope the platform increases cooperation with civil society organisations, however recent restrictions imposed by the platform are cause for worry. We also recognise the hard work of Facebook employees across different sub-teams, who have done their best to push the company to fix the platform’s misinformation problem. This report is not an indictment of their personal efforts, but rather highlights the need for much more proactive decisions and solutions implemented by the highest levels of executive power in the company.
This study takes a small step towards a better understanding of the scale and scope of the misinformation targeting prominent scientists on Facebook, Instagram, Twitter, Telegram, BitChute and YouTube.
Cooperation across fields, sectors and disciplines is needed more than ever to fight disinformation and misinformation. All social media platforms must become more transparent with their users and with researchers to ensure that the scale of the problem is measured effectively and to help public health officials respond in a more effectual and proportional manner to both the pandemic and the infodemic.
A list of the pieces of misinformation content referenced in this report can be found in the Annex.
It is important to note that although fact-checks from reputable fact-checking organisations provide a reliable way to identify misinformation content, researchers and fact-checkers have a limited window into misinformation spreading in private Facebook groups, on private Facebook profiles and via Facebook messenger.
Similarly, engagement data for Facebook posts analysed in this study are only indicative of wider engagement with, and exposure to, misinformation. Consequently, the findings in this report are likely conservative estimates.
For more information and interviews:
-
media@avaaz.org
-
Andrew Legon (CET timezone) - andrew.legon@avaaz.org / +34 600 820 285
More information about Avaaz’s disinformation work:
Avaaz is a global democratic movement with more than 66 million members around the world. All funds powering the organisation come from small donations from individual members.
This report is part of an ongoing Avaaz campaign to protect people and democracies from the dangers of disinformation and misinformation on social media. As part of that effort, Avaaz investigations have shed light on how Facebook was a
significant catalyst in creating the conditions that swept America down the dark path from election to insurrection;
how
Facebook’s AI
failed American voters ahead of Election Day in October 2020; exposed
Facebook's algorithms
as a major threat to public health in August 2020; investigated the US-based
anti-racism protests
where divisive disinformation narratives went viral on Facebook in June 2020; revealed a disinformation network with half a billion views ahead of the
European Union elections
in 2019; prompted Facebook to take down a network reaching 1.7M people in Spain days before the 2019
national election;
released a report on the fake news reaching millions that fuelled the
Yellow Vests crisis
in France; exposed a massive disinformation network during the Brazil presidential elections in 2018; revealed the role anti-vaccination misinformation is having on reducing the vaccine rate in Brazil; and released a report on how YouTube was driving millions of people to watch
climate misinformation videos.
Avaaz’s work on disinformation is rooted in the firm belief that fake news proliferating on social media poses a grave threat to democracy, the health and well-being of communities, and the security of vulnerable people. Avaaz reports openly on its disinformation research so it can alert and educate social media platforms, regulators and the public, and to help society advance smart solutions to defend the integrity of our elections and our democracies. You can find our reports and learn more about our work by visiting:
https://secure.avaaz.org/campaign/en/disinfo_hub/.















 43
43
 44
44




Tell Your Friends